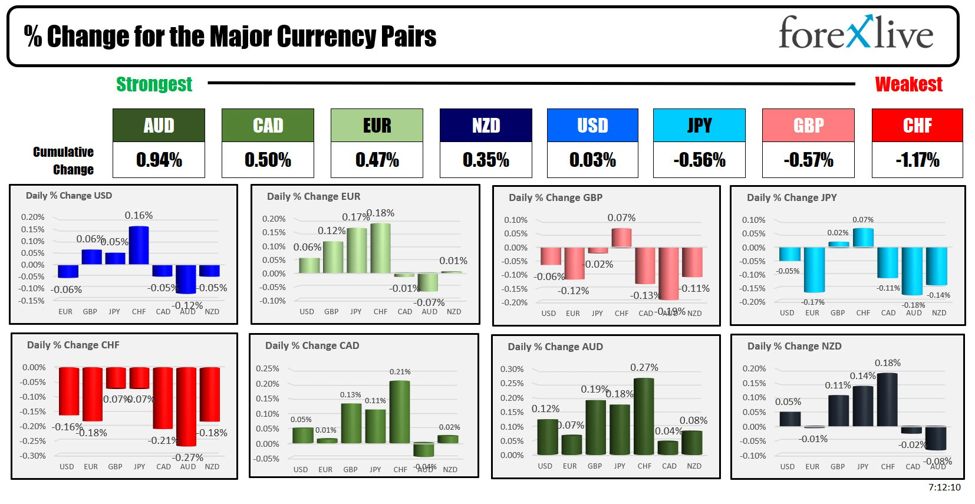

USD
- The Fed left interest rates unchanged as expected at the last meeting with basically no
change to the statement. The Dot Plot still showed three rate cuts for 2024 and
the economic projections were upgraded with growth and inflation higher and the
unemployment rate lower. - The US CPI beat expectations for the third
consecutive month, while the US PPI came in line with forecasts. - The US NFP beat expectations across the board
although the average hourly earnings came in line with forecasts. - The US ISM Manufacturing PMI beat expectations by a big margin with
the prices component continuing to increase, while the US ISM Services PMI missed with the price index dropping to
the lowest level in 4 years. - The US Retail Sales beat expectations across the board by a
big margin with positive revisions to the prior figures. - The market now expects the first rate cut in
September.
NZD
- The RBNZ kept its official cash rate
unchanged as
expected with no change as the central bank continues to state that the OCR
will need to remain at restrictive level for a sustained period. - The latest New Zealand inflation data printed in line with expectations
supporting the RBNZ’s patient stance. - The labour market report beat expectations across the
board with lower than expected unemployment rate and higher wage growth. - The Manufacturing PMI improved in February remaining in
contraction while the Services PMI increased further holding on in
expansion. - The market expects the first cut in
August.
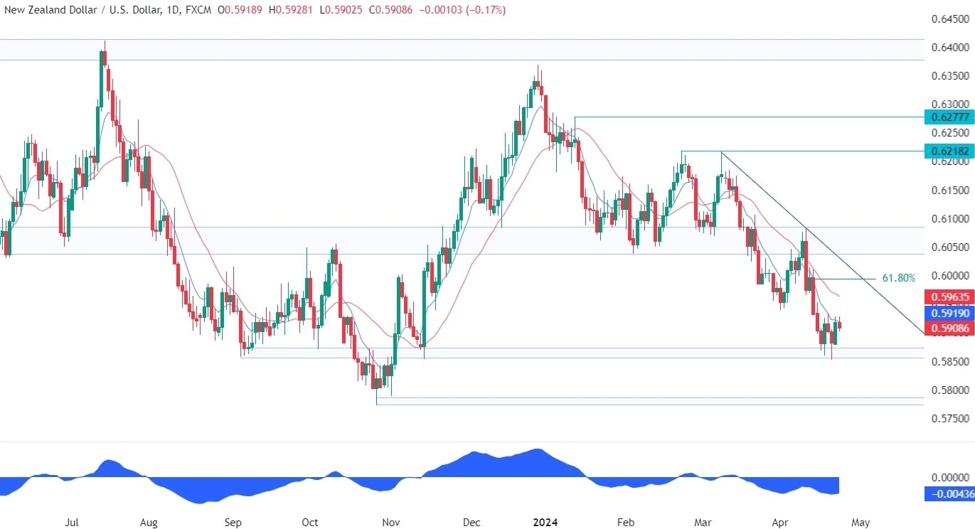
NZDUSD Technical Analysis –
Daily Timeframe
On the daily chart, we can see that NZDUSD bounced
again on the key support zone
around the 0.5870 level. From a risk management perspective, the sellers will
have a much better risk to reward setup around the major trendline where
they will also find the 61.8% Fibonacci retracement level
for confluence. The
buyers, on the other hand, will want to see the price breaking higher to turn
the trend around and start targeting the 0.64 resistance zone.
NZDUSD Technical Analysis –
4 hour Timeframe
On the 4 hour chart, we can see that the latest leg
lower into the support diverged with the
MACD which is
generally a sign of weakening momentum often followed by pullbacks or
reversals. In this case, it might be a signal for a bigger reversal, and it
might even end up being a double bottom with the
major trendline as the target. In fact, the buyers will likely increase the
bullish bets into the major trendline if the price were to break above the
neckline at 0.5933. The sellers, on the other hand, should pile in around these
levels to position for a drop back into the support targeting a break below it.
NZDUSD Technical Analysis –
1 hour Timeframe
On the 1 hour chart, we can see that the
price continues to print higher lows as it trades towards the neckline. This
signals that the bullish trend is intact on this timeframe and buyers are
pushing into a breakout. If the price were to break below the most recent
higher low at 0.5995, then the bullish trend would be invalidated and the
sellers will start to pile in more aggressively to push the pair into new lows.
Upcoming Events
Today we get the US Flash PMIs. On Thursday we will
see the latest US Jobless Claims figures, while on Friday we conclude the week
with the US PCE report.
This article was written by FL Contributors at www.forexlive.com.
Source link