
Fundamental
Overview
The Yen continues to
struggle despite the dovish expectations around the Fed’s interest rates path.
Yesterday, we got a big downside surprise in the US
PPI report and although the USD weakened heavily against the other major
currencies, the JPY failed to sustain the gains.
One of the main reasons is
that the positive risk sentiment favours the higher yielding currencies. The
other reason is that the Japanese yields have been falling faster compared to
the other major currencies as the recent volatility in the Japanese markets
reduced the probabilities of further rate hikes.
For the Fed, the market is split
between a 25 and 50 bps cut in September and a total of 107 bps of easing by
year-end. On the BoJ side, the market isn’t pricing any more rate hikes for
this year as there are just 7 bps of tightening expected by year-end.
USDJPY
Technical Analysis – Daily Timeframe
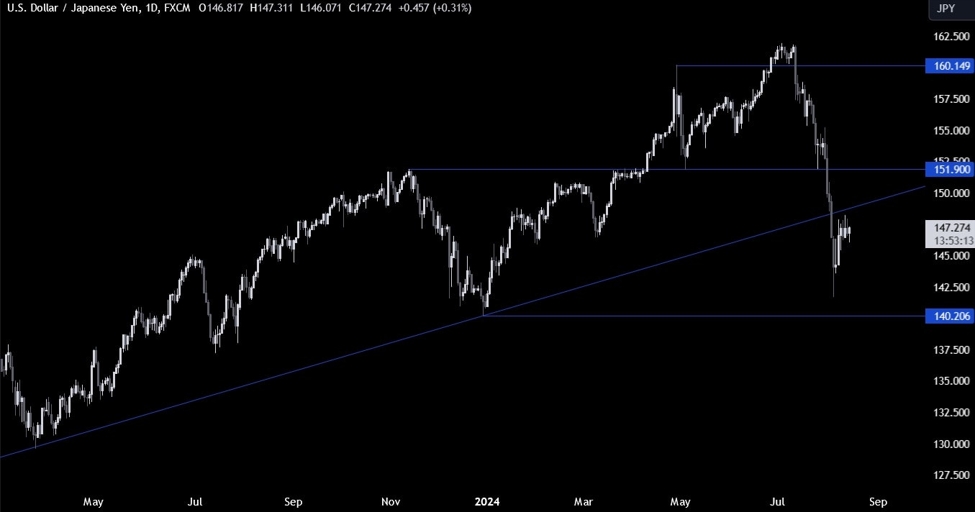
On the daily chart, we can
see that USDJPY is consolidating just beneath the major broken trendline
around the 148.00 handle. The sellers will likely step in around the broken
trendline to position for a drop into the 140.00 handle, while the buyers will
want to see the price rising above the trendline to gain more control and
target new highs.
USDJPY Technical
Analysis – 4 hour Timeframe
On the 4 hour chart, we can
see that from a risk management perspective, the sellers will have a better
risk to reward setup around the 149.00 handle where they will find the confluence of the upward broken trendline and the downward trendline. The buyers, on the other
hand, will want to see the price breaking higher to increase the bullish bets
into new highs.
USDJPY Technical
Analysis – 1 hour Timeframe
On the 1 hour chart, we can
see more clearly the consolidation between the 146.00 support and the 148.00 resistance. The buyers will
want to see the price breaking higher to pile in for a rally into the trendline
targeting a breakout above it. The sellers, on the other hand, will look for a
break lower to position for a drop into the 140.00 handle. The red lines define
the average daily range for today.
Upcoming
Catalysts
Today we have the US CPI report. Tomorrow, we get the US Retail Sales and
Jobless Claims figures. Finally, on Friday, we conclude the week with the
University of Michigan Consumer Sentiment survey.
See the video below
This article was written by Giuseppe Dellamotta at www.forexlive.com.
Source link