Fundamental
Overview
The JPY started the week on
the wrong foot following the Japanese
elections over the weekend where the ruling party lost the majority. The
main culprit for the US Dollar strength has been the rally in long term
Treasury yields.
The yield curve has been
bear-flattening which is what you would expect with higher growth and
potentially higher inflation expectations. There’s a good argument that the
markets have been already positioning for a Trump’s victory which is expected
to strengthen the higher growth and less rate cuts expectations.
As previously mentioned, this
is the trend for now and it’s generally a bad idea to fight such trends without
a strong catalyst. Unfortunately, the JPY lacks bullish drivers as everything
points to more weakening unless Harris wins the US elections, and we get a
correction in Treasury yields and the US Dollar.
USDJPY
Technical Analysis – Daily Timeframe
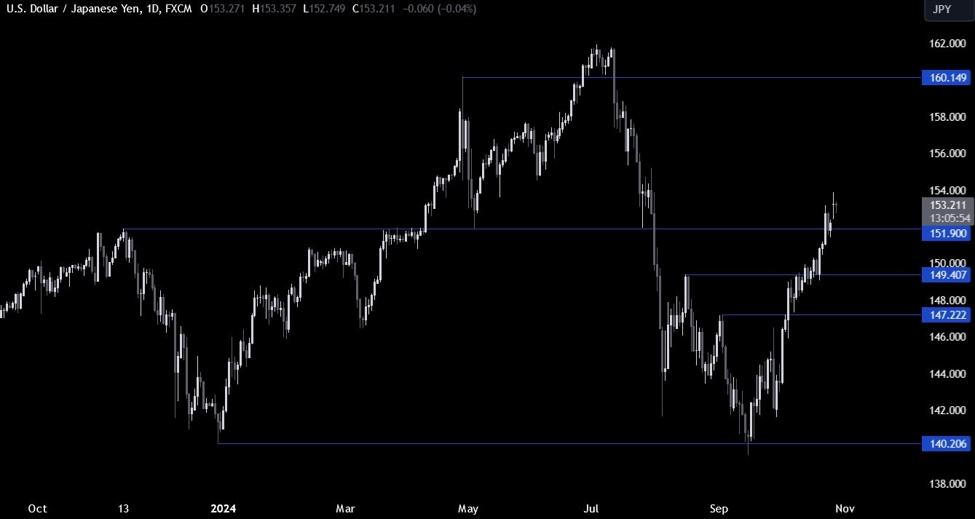
On the daily chart, we can
see that USDJPY bounced on the key 152.00 handle and extended the rally into a
new high following the Japanese election result. The buyers will likely keep on
looking for dip-buying opportunities on the lower timeframes as long as we stay
above the 152.00 handle. The sellers, on the other hand, will want to see the
price breaking below the 152.00 handle to start targeting the 149.40 level
next.
USDJPY Technical
Analysis – 4 hour Timeframe
On the 4 hour chart, we can
see that we have an upward trendline defining the current bullish
momentum. The buyers will likely lean on the trendline to target new highs,
while the sellers will want to see the price breaking below the trendline and
the 152.00 handle to pile in for a pullback into the 149.40 level.
USDJPY Technical
Analysis – 1 hour Timeframe
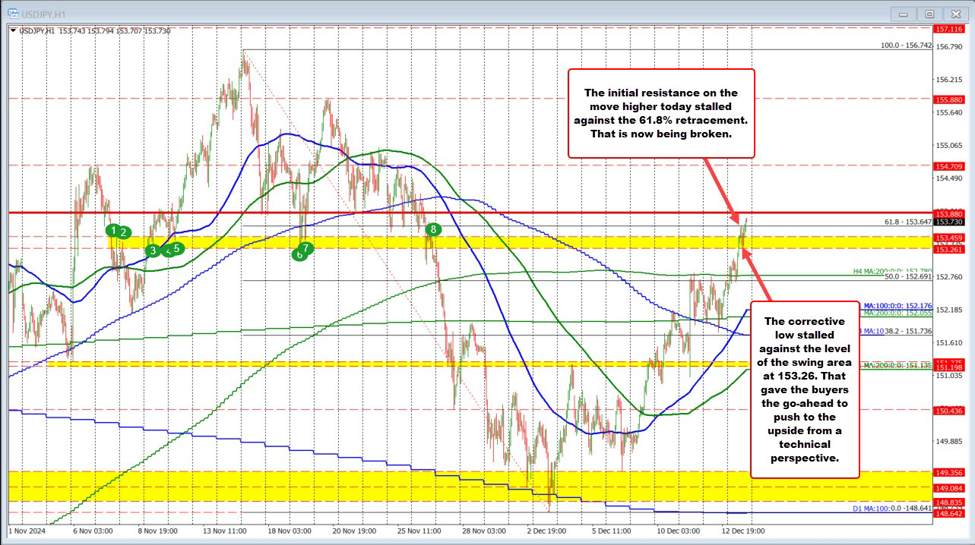
On the 1 hour chart, we can
see that we have a minor resistance zone around the 153.30 level. This is where
we can expect the sellers to step in with a defined risk above the resistance
to position for the break below the trendline. The buyers, on the other hand,
will want to see the price breaking higher to increase the bullish bets into
new highs. The red lines define the average daily range for today.
Upcoming
Catalysts
Today we have the US Job Openings and the US Consumer Confidence report. Tomorrow,
we get the US ADP and the US GDP. On Thursday, we have the US PCE, the US
Jobless Claims and the US Employment Cost Index data. Finally, on Friday, we
conclude the week with the US NFP and the US ISM Manufacturing PMI.
See the video below
This article was written by Giuseppe Dellamotta at www.forexlive.com.
Source link


