
Fundamental
Overview
Yesterday, the yen
strengthened across the board in the Asian session without any clear catalyst. It
looks like it was more of a technical move as the price broke through a key
trendline rather than something fundamental.
On the other side, there
might be some pre-positioning into a dovish Powell speech on Friday as he will
likely pre-commit to a rate cut in September. In the big picture though, rate
cuts into resilient growth should boost economic activity and keep long term
yields high.
Moreover, the risk-on
sentiment should also weigh on the yen as the carry trades would still be a
better option. So, although the picture is a bit murkier with Federal Reserve
rate cuts and potential BoJ rate hikes, it’s hard to see the yen appreciating in
the long term without a more pronounced slowdown in the US economy.
Nonetheless, the trend for
now remains skewed to the downside, so we will need some “confirmation” from the
technical side to start looking for more upside or discard the idea.
USDJPY
Technical Analysis – Daily Timeframe
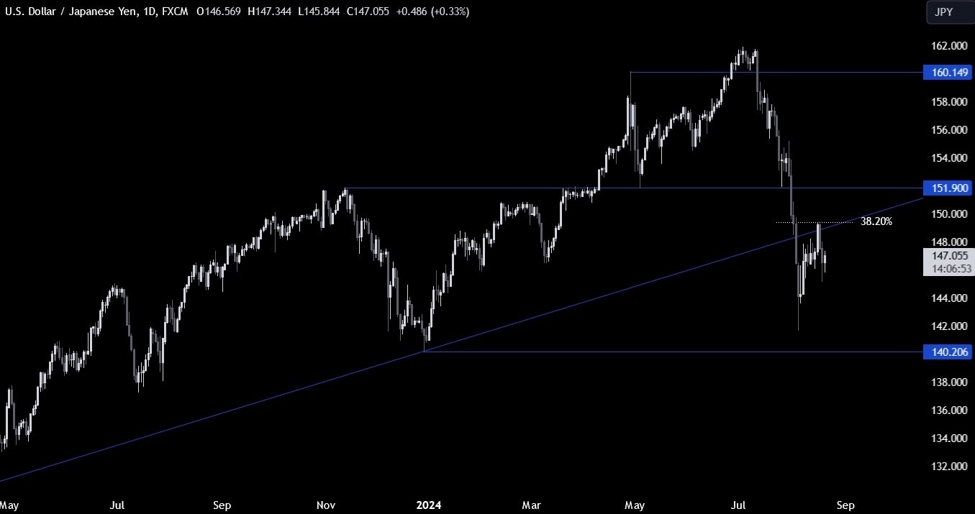
On the daily chart, we can
see that USDJPY rejected the broken trendline around the 149.00 handle where we
had also the 38.2% Fibonacci
retracement level for confluence.
That’s where the sellers stepped in to position for a drop into the 140.00
handle. The buyers will want to see the price breaking above the 149.00 handle
to gain more conviction and position for a rally into new highs.
USDJPY Technical
Analysis – 4 hour Timeframe
On the 4 hour chart, we can
see that the price probed a little above the downward trendline last week, but
eventually got smacked back down and fell even more as the price broke below
the counter-trendline around the 147.60 level.
The price has now pulled
back to the downward trendline, and this is where we can expect the sellers to
step in with a defined risk above the trendline to position for a drop into the
140.00 handle. The buyers, on the other hand, will want to see the price breaking
higher to gain even more control and position for a break above the 149.00
handle.
USDJPY Technical
Analysis – 1 hour Timeframe
On the 1 hour chart, we can
see that the price returned inside the previous range between the 146.00 support
and the 148.00 resistance. The resistance zone is right around the downward
trendline, so the sellers will have a nice barrier where to protect their stops.
We have also a minor
counter-trendline around the support, so a break below it should see the bearish
momentum increasing as the sellers will pile in more aggressively. The buyers,
on the other hand, will need the price to break above the 148.00 resistance to
start targeting new highs. The red lines define the average daily range for today.
Upcoming
Catalysts
On Thursday we get the US Jobless Claims figures and the US PMIs.
On Friday we conclude with the Japanese CPI and Fed Chair Powell speaking at
the Jackson Hole Symposium.
See the video below
This article was written by Giuseppe Dellamotta at www.forexlive.com.
Source link