
Fundamental
Overview
The USD last week saw a
quick dip against the Yen following the soft US CPI report as the market priced back in two rate
cuts by the end of the year. The moves were reversed soon after though as we
got a bit more hawkish than expected FOMC decision where the dot plot showed that the Fed expected just one cut for
this year despite the soft US CPI report.
Later on, Fed Chair Powell backpedalled on the projections making them a
bit less worrying as the central bank remains very data dependent. Nonetheless,
the path of least resistance remains to the upside as the market doesn’t have
strong bullish drivers for the Yen yet.
In fact, the JPY continues
to lose ground against the major currencies amid the general pickup in global
growth and overall positive risk sentiment, even if we get bouts of risk-off
here and there. We will likely need weak US growth data to see some more Yen strength,
but it might be short lived if it’s not enough to make the market to price in more
aggressive rate cuts for the Fed.
The BoJ disappointed the markets last week leaving bond
purchases unchanged despite expectations of a reduction. This was reversed in
the press conference though as BoJ Governor Ueda said that they will begin tapering
bond purchases immediately after the July meeting and the size of the tapering
will be substantial.
In the bigger picture
though, this is mostly noise as the pickup in global growth and the positive
risk sentiment are stronger drivers at the moment.
USDJPY
Technical Analysis – Daily Timeframe
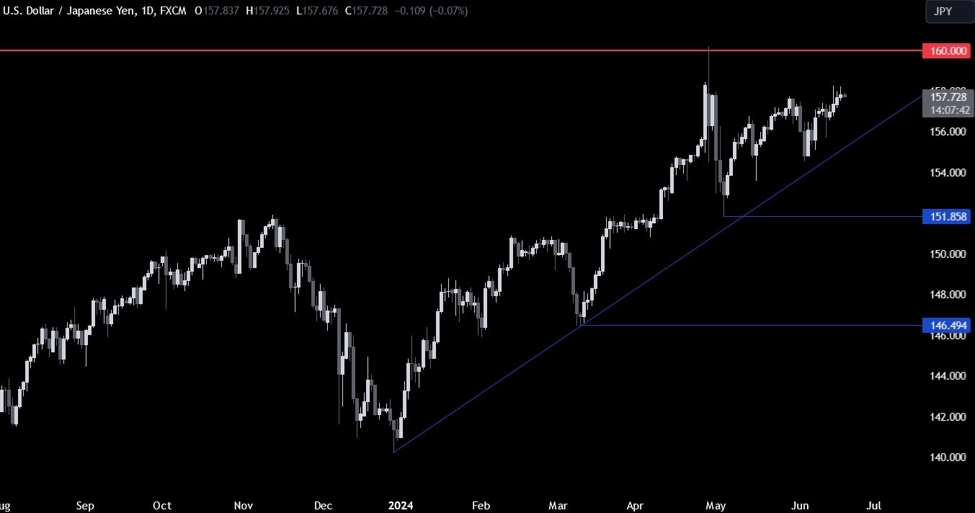
On the daily chart, we can
see that USDJPY continues to drift higher towards the intervention level at
160.00. That’s where we will likely find the sellers stepping in more
aggressively with a defined risk above the level to position for a drop into the
trendline.
If the price were to
further break below the trendline it would give the sellers a bit more
confidence to increase the bearish bets and start targeting new lows with the
151.85 level as the first target.
USDJPY Technical
Analysis – 4 hour Timeframe
On the 4 hour chart, we can
see that the price is trading right around the key 158.00 resistance.
The buyers will want to see a breakout to the upside to increase the bullish
bets into the 160.00 level, while the sellers will likely lean on it to
position for a drop into the trendline.
USDJPY Technical
Analysis – 1 hour Timeframe
On the 1 hour chart, we can
see that the price has been trading inside a rising channel and continues to
struggle around the resistance. If we get a pullback from this level, the
buyers will likely step in around the 157.00 handle where we have the confluence
of the lower bound of the channel and the 50% Fibonacci
retracement level. The red lines define the average
daily range for today.
Upcoming
Catalysts
Tomorrow we get the US Housing Starts, Building Permits and the latest US
Jobless Claims figures. On Friday, we conclude the week with the Japanese and
US PMIs.
See the video below
This article was written by Giuseppe Dellamotta at www.forexlive.com.
Source link