
Fundamental
Overview
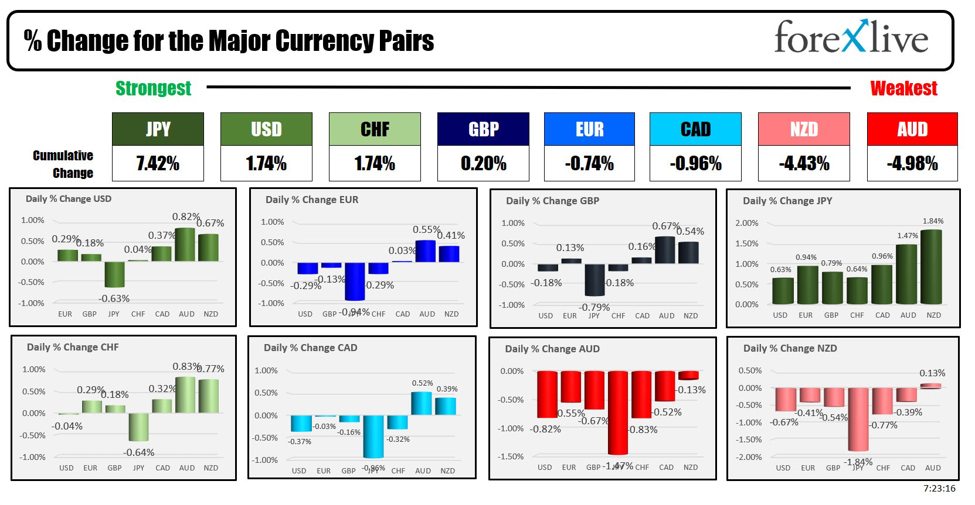
The weak US
NFP report last Friday led to a key breakout in the USDJPY pair which
eventually triggered another deleveraging in the Yen carry trades. Things got dire
yesterday as the Nikkei dropped 12% overnight and we saw a general selloff in
global stock markets.
At one point, the markets
saw the Fed cutting rates by 136 bps by year-end and some chances of an emergency
rate cut. Fear is generally a stronger emotion than greed in the markets. Although
the volatility calmed down a bit, the markets are still expecting a 50 bps cut by
the Fed in September and a total of 110 bps by year-end.
Unfortunately, the calendar
is pretty empty this week and the only notable release will be on Thursday when
we get the latest US Jobless Claims figures. Given the market’s sensitivity to
weak releases, if we get bad data, we might see some more risk-off flows
dominating the price action. On the other hand, good figures could see the risk
sentiment getting a bit better.
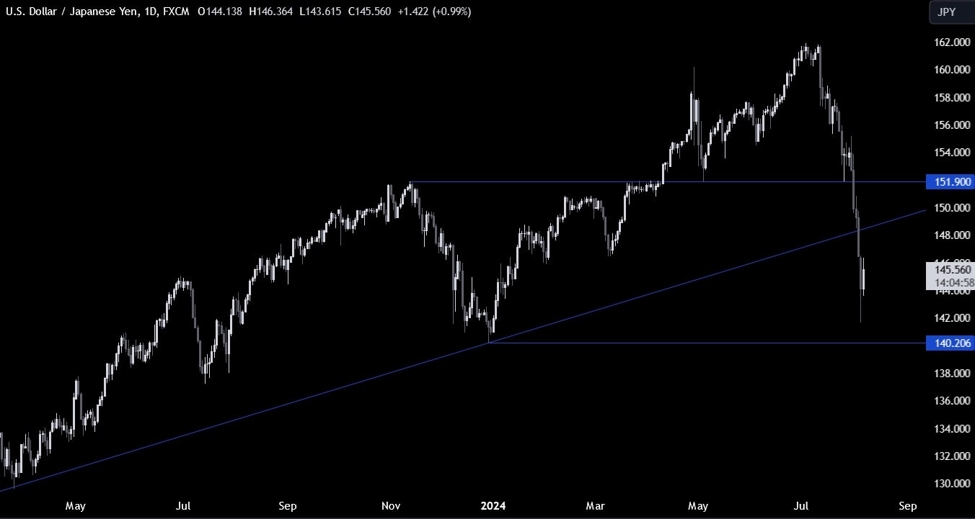
USDJPY
Technical Analysis – Daily Timeframe
On the daily chart, we can
see that USDJPY eventually broke through the key trendline following the weak US NFP report
and extended the drop into the 142.00 handle as we got some more deleveraging on
the carry trades. The price is now trading in the middle of two key levels.
If we were to get another
flush lower, the buyers will likely step in around the 140.00 handle with a
defined risk below it to position for a rally into new highs. The sellers, on
the other hand, will want to see the price breaking lower to increase the
bearish bets into the 136.00 handle next.
USDJPY Technical
Analysis – 4 hour Timeframe
On the 4 hour chart, we can
see that we have a downward trendline defining the current bearish momentum. The
sellers will likely lean on the trendline with a defined risk above it to
position for a drop into the 140.00 handle. The buyers, on the other hand, will
want to see the price breaking higher to increase the bullish bets into the
next major trendline around the 152.00 handle.
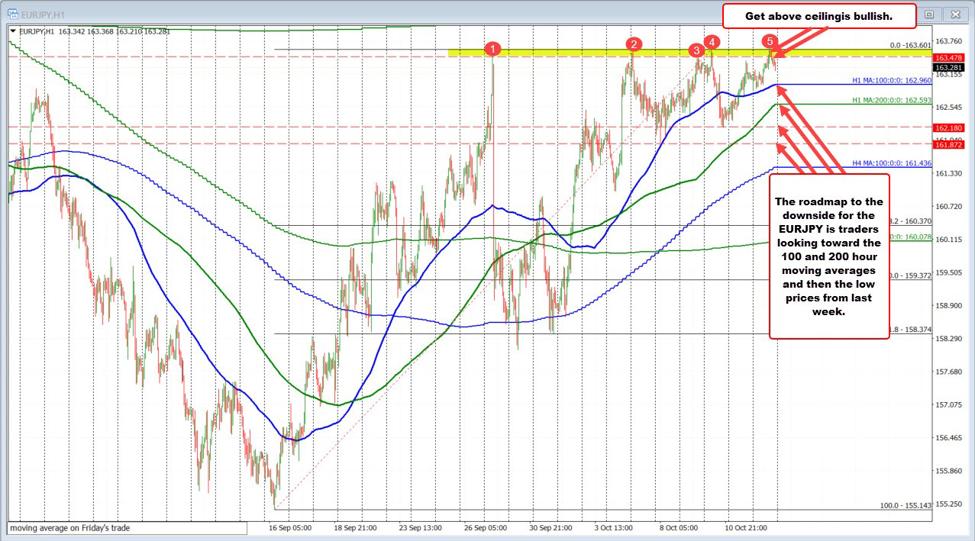
USDJPY Technical
Analysis – 1 hour Timeframe
On the 1 hour chart, we can
see that the price is currently testing the trendline and we’ve been seeing
some rejections as the sellers started to pile in. A drop below the 144.00
handle will likely confirm another flush lower into the 140.00 handle next. A
breakout to the upside, on the other hand, should increase the bullish momentum
into the next major trendline. The red lines define the average daily range for today.
Upcoming
Catalysts
This week is basically empty on the data front. The only notable economic release
will be on Thursday when we get the latest US Jobless Claims figures. The
market will also pay close attention to Fed members’ comments given the latest
developments in the markets.
See the video below
This article was written by Giuseppe Dellamotta at www.forexlive.com.
Source link