
Fundamental
Overview
Last Friday, Fed Chair
Powell delivered a more dovish than expected speech at the Jackson Hole Symposium as he
basically kept the door open for a 50 bps cut at the September meeting. In
fact, the line saying that they will do everything they can to support a strong
labour market was key.
That pushed Treasury yields
lower and weighed on the US Dollar across the board giving the yen a boost as
the carry trades continue to lose some appeal. Nonetheless, the Fed is cutting
rates into a resilient economy, so one has to be mindful that we might eventually
get an increase in economic activity that could lift long term yields.
That might not be the
market’s focus at the moment as we head into the first cut because we will need
a catalyst to change the narrative. The focus right now is on the US labour
market data as more weakening could not only trigger a more aggressive Fed
easing but also bring back recessionary fears which should support the yen.
USDJPY
Technical Analysis – Daily Timeframe
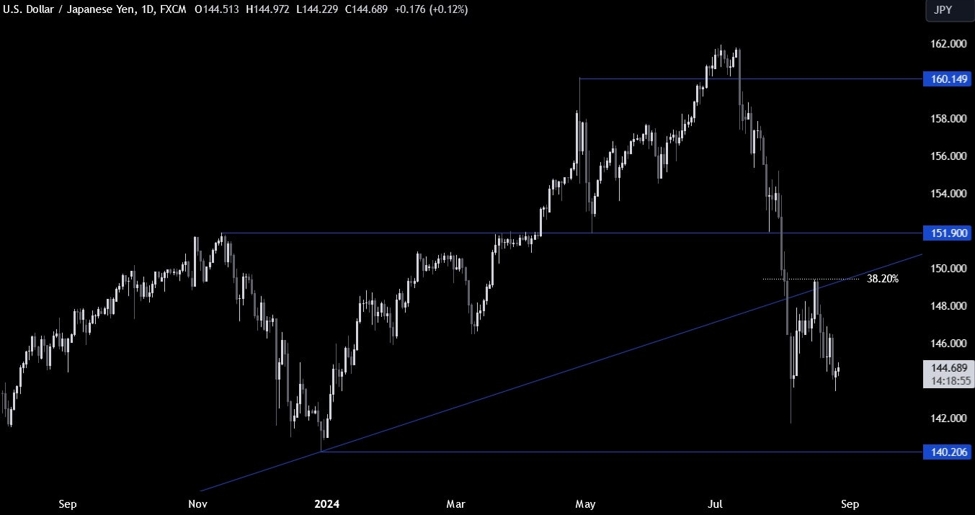
On the daily chart, we can
see that USDJPY rejected the broken trendline around the 149.00 handle where we
had also the 38.2% Fibonacci retracement level for confluence and dropped all the way down to the
143.50 level.
The sellers remain in
control for now and will keep on targeting the 140.20 low. If the price gets
there, that’s where we can expect the buyers to step in with a defined risk
below the level to position for a rally into new highs.
USDJPY Technical
Analysis – 4 hour Timeframe
On the 4 hour chart, we can
see that we have a major downward trendline defining the current downtrend. We
can expect the sellers to keep on leaning on it to position for new lows with a
defined risk above it. The buyers, on the other hand, will want to see the price
breaking higher to start piling in for new highs.
USDJPY Technical
Analysis – 1 hour Timeframe
On the 1 hour chart, we can
see that we have a minor counter-trendline defining the current bullish
momentum on this timeframe. The buyers will likely keep on leaning on it to
position for a break above the major trendline, while the sellers will want to
see the price breaking lower to increase the bearish bets into the 140.00
handle. The red lines define the average daily range for today.
Upcoming
Catalysts
Today we have the US Consumer Confidence report. On Thursday, we get the
latest US Jobless Claims figures. On Friday, we conclude with the Tokyo CPI and
the US PCE report.
This article was written by Giuseppe Dellamotta at www.forexlive.com.
Source link