
Fundamental
Overview
The USDJPY pair eventually
erased the entire drop following the more dovish than expected Powell’s speech at the Jackson Hole Symposium. The
focus is now on the key data this week with the ISM Manufacturing PMI and the
NFP reports in the spotlight.
The market is waiting for
the key economic releases this week, and especially the NFP report, as that
will likely decide whether the Fed is going to deliver a standard 25 bps cut or
go for a more aggressive 50 bps cut in the upcoming meeting.
Right now, it looks like
the Fed is going to cut rates into a resilient economy, so one has to be
mindful that we might eventually get an increase in economic activity that
could lift long term yields.
That might not be the
market’s focus at the moment but it’s something to keep an eye on. The focus
right now is on the US labour market data as more weakening could not only
trigger a more aggressive Fed easing but also bring back recessionary fears
which should support the yen.
Therefore, besides the
headline ISM number today, watch also the employment sub-index as a drop into
new lows could spook the markets while an improvement could lead to a positive
sentiment.
USDJPY
Technical Analysis – Daily Timeframe
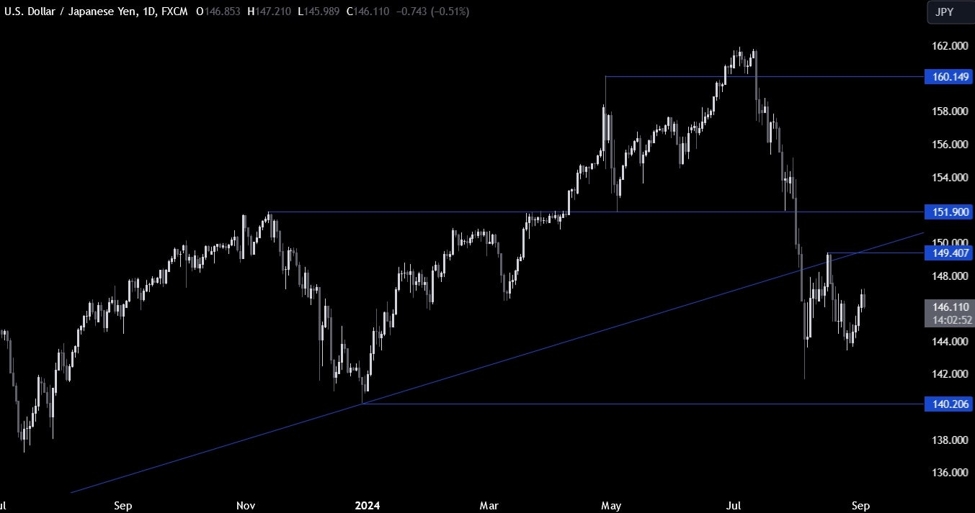
On the daily chart, we can
see that USDJPY hasn’t moved much as the market has been waiting for stronger
catalysts to push the pair in either direction. This week is going to be very
important as we get the ISM Manufacturing PMI and the NFP report. On the
upside, the buyers will target the 150.00 handle, while on the downside, the
sellers will look for the 140.00 handle.
USDJPY Technical
Analysis – 4 hour Timeframe
On the 4 hour chart, we can
see that the price recently broke above the major downward trendline
and increased the bullish momentum as the buyers piled in while the sellers
squared their positions.
We now have a minor upward
trendline defining the current momentum and we can expect the buyers to lean on
it to position for a rally into the 150.00 handle. The sellers, on the other
hand, will want to see the price breaking lower to increase the bearish bets
into the 140.00 handle.
USDJPY Technical
Analysis – 1 hour Timeframe
On the 1 hour chart, we can
see that we have a strong support zone around the trendline where we can also
find the confluence
of the previous swing low level and the 61.8% Fibonacci
retracement level.
This is where the buyers
will likely pile in with a defined risk below the support to position for a
rally into the 150.00 handle. The sellers, on the other hand, will want to see
the price breaking lower to target new lows. The red lines define the average daily range for today.
Upcoming
Catalysts
Today we have the US ISM Manufacturing PMI. Tomorrow, we have the US Job
Openings. On Thursday, we get the Japanese wage data, the US Jobless Claims
figures and the ISM Services PMI. Finally, on Friday, we conclude the week with
the US NFP report.
This article was written by Giuseppe Dellamotta at www.forexlive.com.
Source link