
Fundamental
Overview
Yesterday, the Fed finally started its easing cycle and decided to do it with a 50 bps
cut. The market was already leaning towards a 50 bps move, so it wasn’t a
surprise.
The larger cut was framed
as kind of an “insurance” cut with the dot plot showing two more 25 bps cuts by
the end of the year and less than the market expected in 2025.
The US Dollar weakened
initially but eventually shot higher as Treasury yields rallied on a less
dovish than expected Powell with the market pricing out the aggressive rate
cuts expected in 2025.
Now that the decision is
behind us, the focus will be on the economic data. If we start to see an
improvement, then Treasury yields will likely continue to rise and drive USDCHF
higher. Conversely, if the data weakens significantly, the market will start to
worry about a recession and take USDCHF lower.
USDCHF
Technical Analysis – Daily Timeframe
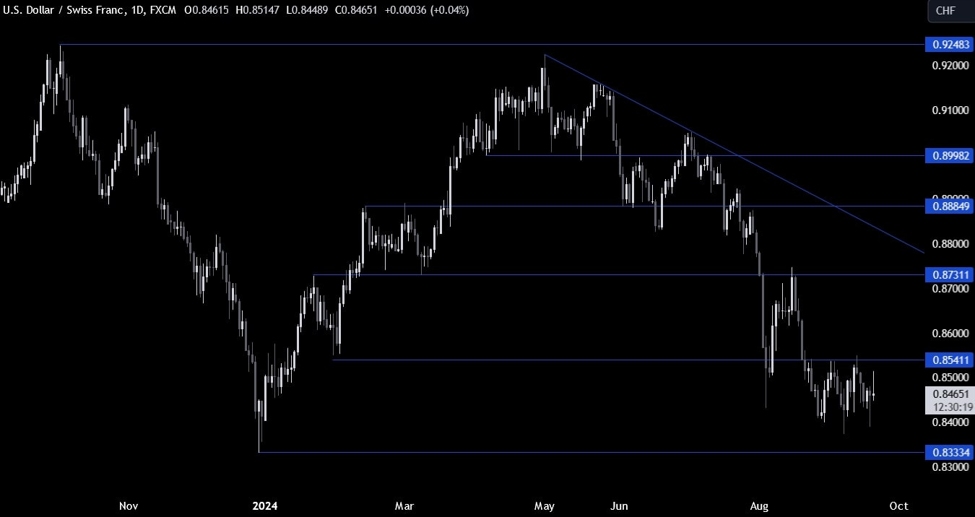
On the daily chart, we can
see that USDCHF has been stuck in a range between the key 0.8555 resistance and 0.8400 support. There’s not
much we can say here as the buyers will want to see the price breaking to the
upside to increase the bullish bets into the 0.8731 level, while the sellers
will look for a break to the downside to target a drop below the 0.8333 level.
USDCHF Technical
Analysis – 4 hour Timeframe
On the 4 hour chart, we can
see that the price shot higher yesterday after the Fed decision and got
rejected from the key trendline as the sellers piled in with a
defined risk above it to position for new lows. The buyers will need the price to
break above the trendline to increase the bullish bets into new highs.
USDCHF Technical
Analysis – 1 hour Timeframe
On the 1 hour chart, we can
clearly see the choppy price action with no real direction although the bias
might be skewed to the upside after the Fed’s decision. There’s not much else
we can glean from this timeframe as the buyers will wait for a break of the
trendline or a bounce from the support, while the sellers will look to sell at
the trendline and increase the bets on a break below the support. The red lines
define the average daily range for today.
Upcoming
Catalysts
Today we get the latest US Jobless Claims figures which is the last important
economic release of the week.
This article was written by Giuseppe Dellamotta at www.forexlive.com.
Source link