
Fundamental
Overview
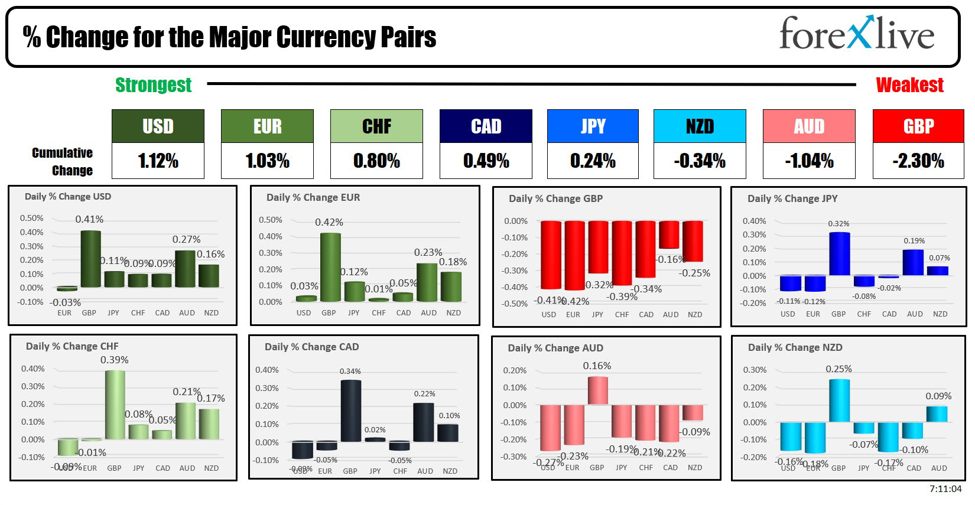
The USDCHF pair eventually dropped
to a new low as a series of soft US data pushed Treasury yields lower giving
the CHF a boost.
The NFP report on Friday wasn’t bad, on the
contrary, the data under the hood was better than the prior month.
Nevertheless, the trend in the labour market continues to remain skewed to the
downside.
The probabilities for the
Fed to cut by 50 bps at the upcoming meeting dropped to 27% following the NFP
report with a total of 110 bps of easing expected by year-end. For the SNB, the
market sees a 73% probability of a 25 bps cut at the upcoming meeting with a
total of 52 bps of easing by year-end.
Right now, it looks like
the Fed is going to cut rates into a resilient economy, so one has to be
mindful that we might eventually get an increase in economic activity that
could lift long term yields and give the US Dollar a boost.
USDCHF
Technical Analysis – Daily Timeframe
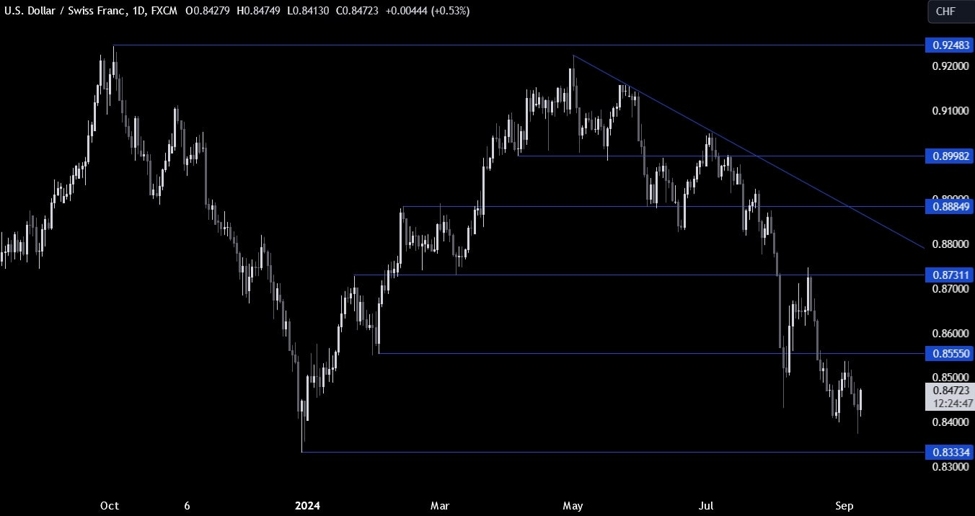
On the daily chart, we can
see that USDCHF spiked into a new low on the NFP release but eventually faded
the entire move. From a risk management perspective, the sellers will have a better
risk to reward setup around the 0.8555 level to position for a break below the
0.8333 level. The buyers, on the other hand, will want to see the price
breaking higher to increase the bullish bets into the 0.8731 level next.
USDCHF Technical
Analysis – 4 hour Timeframe
On the 4 hour chart, we can
see that we have a strong resistance
around the 0.8555 level where we can find the confluence of the trendline and the 50% Fibonacci retracement level. That’s where we can expect
the sellers to step in with a defined risk above the trendline to position for
a break below the 0.8333 level. The buyers, on the other hand, will want to see
the price breaking higher to increase the bullish bets into the 0.8731 level.
USDCHF Technical
Analysis – 1 hour Timeframe
On the 1 hour chart, we can
see that we have a minor downward trendline defining the recent bearish momentum.
The sellers will likely lean on the trendline to position for new lows, while
the buyers will want to see the price breaking higher to position for a rally
into the 0.8555 resistance. The red lines define the average daily range for today.
Upcoming
Catalysts
Tomorrow we have the US Small Business Optimism Index. On Wednesday, we get the
US CPI report. On Thursday, we have the latest US Jobless Claims figures and
the US PPI data. On Friday, we conclude the week with the University of
Michigan Consumer Sentiment report.
This article was written by Giuseppe Dellamotta at www.forexlive.com.
Source link