Fundamental
Overview
The USD got another boost on
Friday following the NFP report as the data beat expectations by a
big margin almost across the board. The market scaled back the rate cuts
expectations further with now just one cut expected by the end of the year.
The focus remains on
inflation and this week we get the US CPI report on Wednesday. This is the most
important event of the month. Another hot report will likely cause some trouble
in the markets with the stock market looking as the most vulnerable right now.
The best outcome would be a
soft report given the overstretched moves in the markets caused by the
repricing in rate cuts expectations. That would likely reverse most of the
recent trends and trigger a rally in bonds, risk assets like stocks and bitcoin
and lead to a selloff in the US Dollar.
On the CHF side, the SNB cut interest rates by 50 bps at the last
policy meeting bringing the policy rate to 0.50% and dropping the language
signalling further cuts in the coming quarters. This suggests that the central
bank will likely slow the pace of easing which is something that the market was
already expecting with two 25 bps cuts priced in for this year.
The Swiss CPI last week didn’t change much
for the central bank as the data came basically in line with expectations.
USDCHF
Technical Analysis – Daily Timeframe
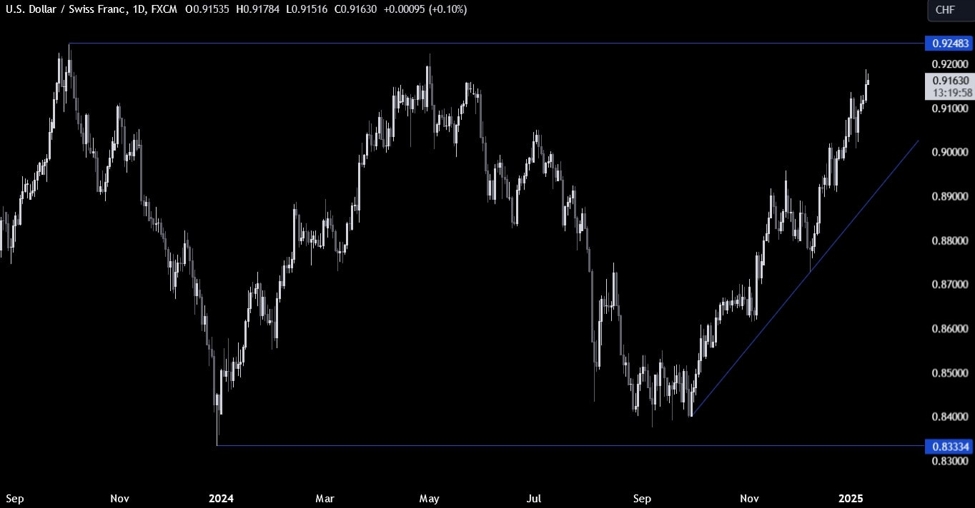
On the daily chart, we can
see that USDCHF extended the rally above the 0.91 handle and came close to the
0.92 handle. From a risk management perspective, the buyers will have a better
risk to reward setup around the trendline. The sellers, on the other hand,
will want to see the price breaking lower to increase the bearish bets into the
0.87 handle next.
USDCHF Technical
Analysis – 4 hour Timeframe
On the 4 hour chart, we can
see that we have a minor trendline defining the bullish momentum on this timeframe.
The buyers will likely keep on leaning on it to position for further upside,
while the sellers will look for a break lower to target a drop into the major
trendline.
USDCHF Technical
Analysis – 1 hour Timeframe
On the 1 hour chart, we can
see that we have another minor trendline. The buyers will likely step in around
these levels to position for an extension into the 0.9250 resistance,
while the sellers will look for a break below the trendline and the 0.9130
level to target the next trendline around the 0.91 handle. The red lines define
the average daily range for today.
Upcoming
Catalysts
Tomorrow, we get the US PPI data. On Wednesday, we have the US CPI report. On
Thursday, we get the latest US Jobless Claims figures.
This article was written by Giuseppe Dellamotta at www.forexlive.com.
Source link


