Fundamental
Overview
The USD got a boost
yesterday following an ugly US ISM Manufacturing PMI as the markets went into risk-off. Overall, we had goldilocks data releases
until now with an economy that’s been slowing but still growing. So, one bad
report might not be a gamechanger, but the markets are increasingly sensitive
to bad news in this part of the cycle.
On the monetary policy
front, we had the FOMC rate decision on Wednesday and as expected it was
a dovish one. Fed Chair Powell hinted to a September rate cut and didn’t even
close the door for “several” rate cuts before the end of the year. The market
has now fully priced in three rate cuts by the end of the year and continues to
raise the chances of a 50 bps cut in September.
The CHF, on the other hand,
has been gaining steadily against the major currencies because of the risk-off
sentiment. On the monetary policy front, today’s Swiss CPI report came in line with
expectations matching the last month’s readings. This continues to show that there’s
no need for the central bank to worry about inflation. The probabilities for
another rate cut in September are currently at 77% with a total of 40 bps of
easing expected before year-end.
USDCHF
Technical Analysis – Daily Timeframe
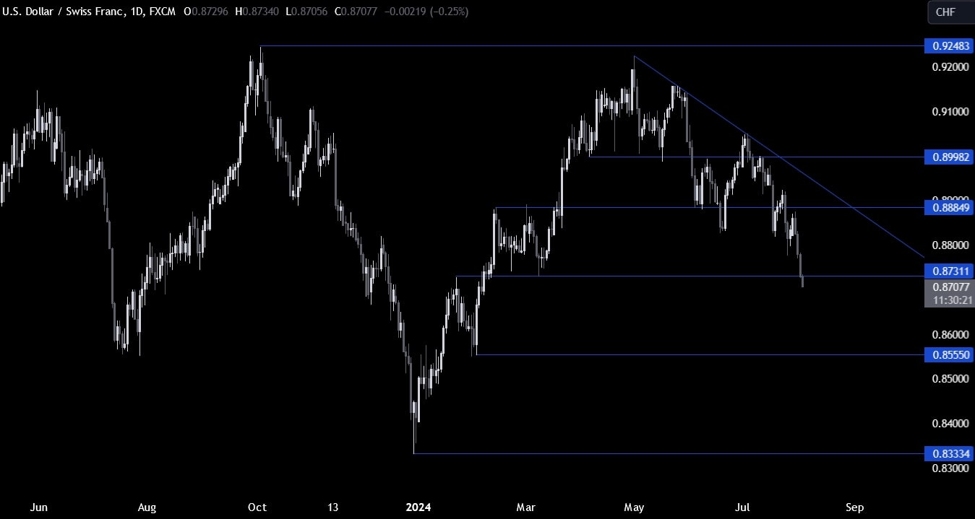
On the daily chart, we can
see that USDCHF is falling below the 0.8730 support as risk-off sentiment continues to dominate
the markets. We can expect the sellers to increase the bearish bets on this
break and position for a drop into the 0.8550 level next. The buyers, on the
other hand, will want to see the price rising back above the support to start
positioning for a pullback into the 0.88 handle.
USDCHF Technical
Analysis – 4 hour Timeframe
On the 4 hour chart, we can
see that from a risk management perspective, the sellers will have a much
better risk to reward setup at the trendline
around the 0.88 handle. The buyers, on the other hand, will want to see the
price breaking above the trendline to increase the bullish bets into the next
major trendline around the 0.8950 level.
USDCHF Technical
Analysis – 1 hour Timeframe
On the 1 hour chart, we can
see that we have another minor trendline defining the current bearish momentum.
The sellers will likely keep on leaning on it to position for further downside.
The buyers, on the other hand, will want to see the price breaking higher to
gains some more confidence and pile in for a rally into the 0.88 handle. The
red lines define the average daily range for today.
Upcoming
Catalysts
Today we conclude the week with the US NFP report where the consensus expects
175K jobs added in July and the Unemployment Rate to remain unchanged at
4.1%.
This article was written by Giuseppe Dellamotta at www.forexlive.com.
Source link


