
Fundamental
Overview
The USD regained some
strength in latter part of last week. From the monetary policy perspective,
nothing has changed as the market continues to expect at least two rate cuts by
the end of the year and sees some chances of a back-to-back cut in November.
The data continues to
suggest that the US economy remains resilient with inflation slowly falling
back to target. Overall, this should continue to support the soft-landing
narrative and be positive for risk sentiment. The new driver could be Trump now
looking more and more like a potential winner and his policies are seen as
inflationary which could see the Fed eventually going even more slowly on rate
cuts.
The CAD, on the other hand,
has been supported against the US Dollar in the past weeks mainly because of
the risk-on sentiment, although that has changed last week. On the monetary policy front, the recent Canadian CPI sealed the rate cut at the upcoming
meeting as the data missed expectations across the board.
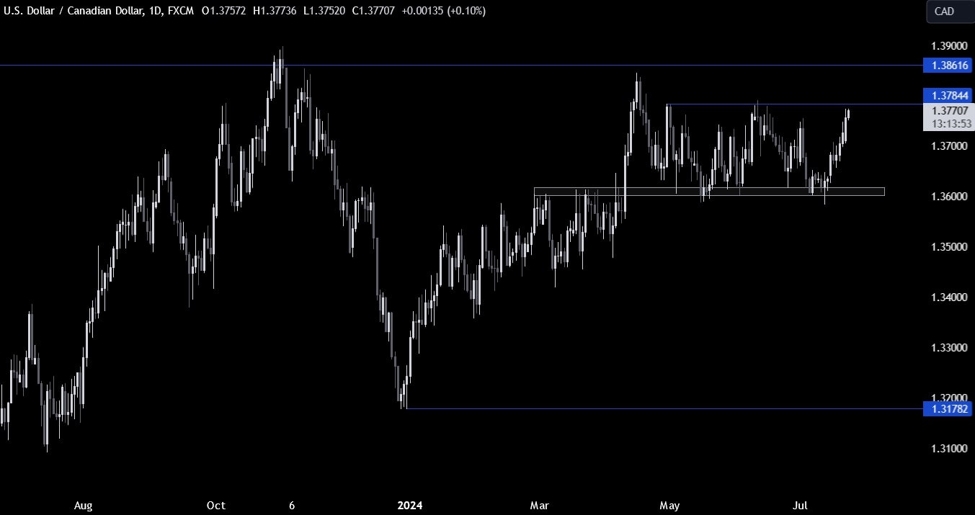
USDCAD
Technical Analysis – Daily Timeframe
On the daily chart, we can
see that USDCAD bounced from the key 1.36 support zone and extended the rally all the way back
to the key resistance around the 1.3785 level.
This is where we can expect
the sellers to step in with a defined risk above the resistance to position for
a drop back into the 1.36 support. The buyers, on the other hand, will want to
see the price breaking above the resistance to increase the bullish bets into
the 1.3860 level next.
USDCAD Technical
Analysis – 4 hour Timeframe
On the 4 hour chart, we can
see that we have a trendline
defining the bullish momentum. From a risk management perspective, the buyers
will have a better risk to reward setup at the trendline to target a break
above the resistance. The sellers, on the other hand, will want to see the price
breaking below the trendline to increase the bearish bets into the 1.36
support.
USDCAD Technical
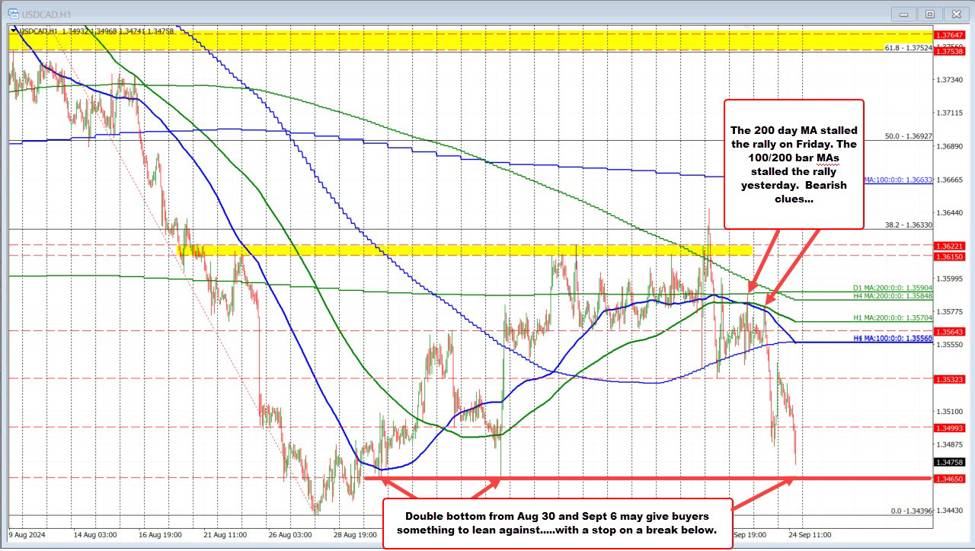
Analysis – 1 hour Timeframe
On the 1 hour chart, we can
more clearly the recent price action. There’s not much to do here other than
waiting for the price to reach the key levels. The red lines define the average daily range for today.
Upcoming
Catalysts
This week is pretty empty on the data front. We begin tomorrow with the BoC
Policy Decision and the US Flash PMIs. On Thursday, we will get the latest US
Jobless Claims figures. Finally, on Friday we conclude the week with the US PCE
report.
This article was written by Giuseppe Dellamotta at www.forexlive.com.
Source link