
Fundamental
Overview
The USD weakened across the
board last Friday following the soft US
NFP report. The data showed some more labour market cooling with an
increase in the unemployment rate and a decrease in wage growth. We basically
have an economy that is slowing but growing. We will see if the market will be
able to keep the positive sentiment on soft landing hopes or start to worry
about a recession. All eyes will now be on the US CPI and US Jobless Claims figures on Thursday.
The CAD, on the other hand,
gained last week against the US Dollar mainly because of the risk-on sentiment as
the US data continued to support at least two rate cuts from the Fed but didn’t
send recessionary signals. For the CAD, the next big event will be the CPI
report on July 16th. We saw another jump in wage growth in the
latest labour
market report, so the BoC will likely need good CPI figures to deliver a
rate cut in July.
USDCAD
Technical Analysis – Daily Timeframe
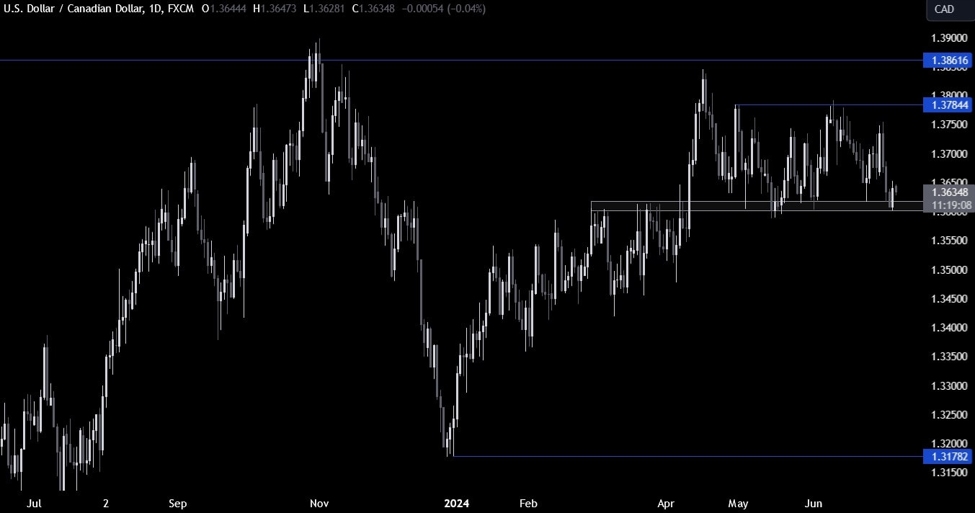
On the daily chart, we can
see that USDCAD has recently dropped back to the bottom of the range at the key
1.36 support
zone where the price bounced off of last Friday.
The buyers will likely keep
on stepping in around these levels to position for a rally back into the 1.3785
resistance with a better risk to reward setup. The sellers, on the other hand,
will want to see the price breaking lower to increase the bearish bets into the
new lows with the 1.35 handle as the first target.
USDCAD Technical
Analysis – 4 hour Timeframe
On the 4 hour chart, we can
see that the price action remains rangebound between the 1.36 support and the
1.3785 resistance. There’s not much to do here and the market participants will
likely keep on “playing the range” until we get a breakout.
USDCAD Technical Analysis – 1 hour Timeframe
On the 1 hour chart, we can
see that the price broke out of the recent downward minor trendline that was defining the bearish
momentum before bouncing from the support. This could be a signal of a change
in momentum.
The buyers will want to see
the price breaking above the most recent lower high at 1.3643 to increase the
bullish bets into the 1.3785 resistance. The red lines define the average daily range for today.
Upcoming
Catalysts
This week is a bit bare on the data front but nonetheless we will have some key
economic releases. Tomorrow, we have Fed Chair Powell testifying to Congress
and the markets will be focused on any view or hint about the monetary policy
trajectory after the recent NFP report. Thursday will be the most important day
of the week as we get the US CPI and the US Jobless Claims figures. Finally, on
Friday, we conclude the week with the US PPI and the University of Michigan
Consumer Sentiment survey.
This article was written by Giuseppe Dellamotta at www.forexlive.com.
Source link