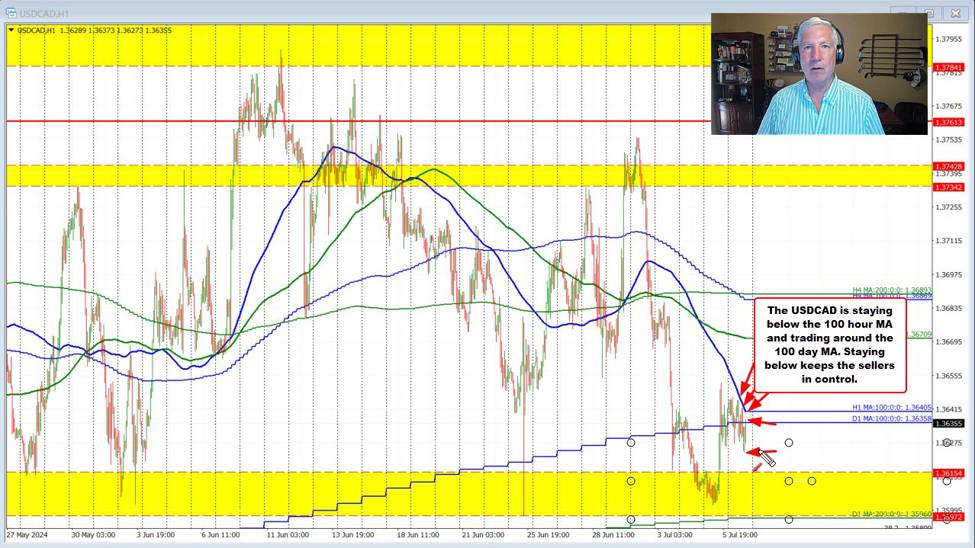

The USDCAD moved lower last week and into a key swing area between 1.3596 and 1.36154. That swing area is joined by its rising 200 day moving average currently at 1.3596 as well. The low price extended to 1.36017 before bouncing higher after the jobs reports in Canada and the US on Friday
The subsequent rise to the price back above its 100-day moving average of 1.36358, but the high price stalled ahead of its falling 100 hour moving average. That pattern has continued today with recent highs on the hourly chart stalling against that moving average (currently at 1.36405).
So with the 100-day, moving average at 1.36358 and the 100-day moving average at 1.36405, that area is setting itself up as a barometer in the short term for both buyers and sellers. Staying below would be more bearish. Moving above and we are likely to see more upside probing.
In this video I outline and show the technical levels in play and explain why
This article was written by Greg Michalowski at www.forexlive.com.
Source link