The USDCAD has been trading in a sideways pattern even though CPI data out of a Canada yesterday was weaker than expected. The unemployment rate is also moving higher with that at the highest level since 2017 (if you take out the spike from 2020 to 2021).
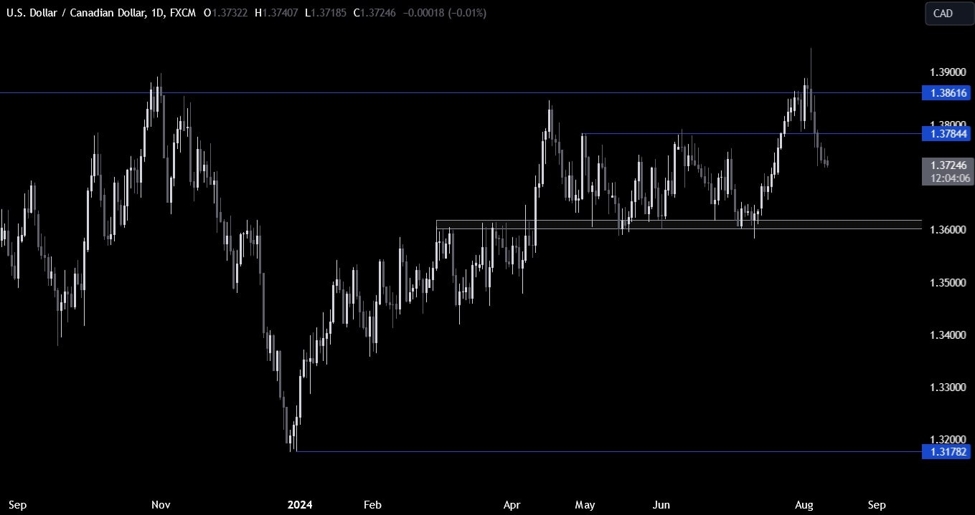
The fundamentals are probably weaker in Canada which gives the USDCAD some upside momentum. However technically, the price highs of the last seven or so trading days has formed a ceiling between 1.3615 and 1.3622.
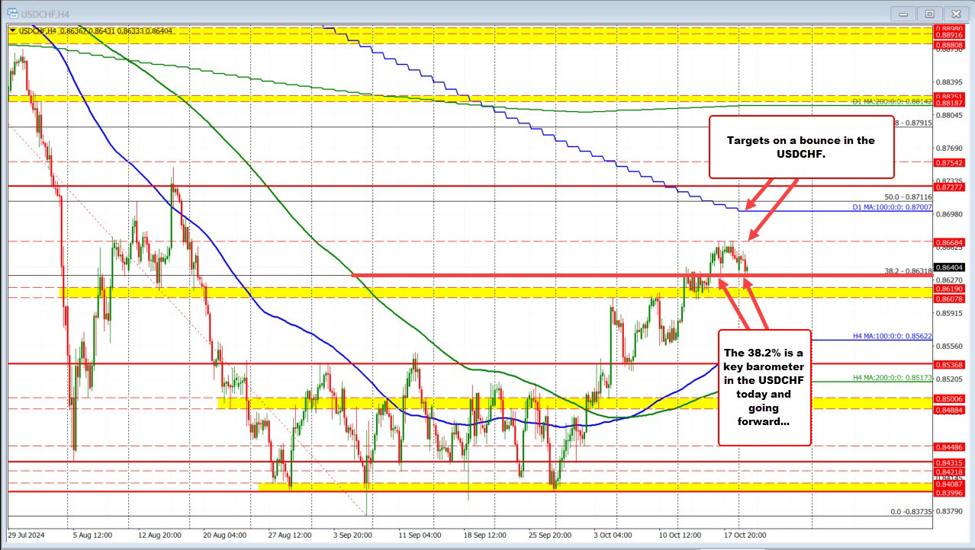
As a result, the price needs to push above that area and also the 38.2% retracement of the move down from the August high at the 1.3633 trade level. If it can get above that level, and opens the door for a run toward the 100-day moving average of 1.3669 followed by the 50% 1.36927.
On a move lower, falling below the 200-hour moving average at 1.3679 in the low over the last seven days near 1.3564, would open a door for a move toward the 100-bar moving average on a 4-hour chart at 1.35377. A move below that, and the bias is more in favor the sellers once again.
This article was written by Greg Michalowski at www.forexlive.com.
Source link