The major stock indices are mixed with the NASDAQ and S&P lower. The small-cap Russell 2000 and Dow industrial average are trading higher. A snapshot of the market currently shows:
- Dow industrial average was 40.07 points or 0.09%.
- S&P index -22.79 points or -0.38%
- NASDAQ index -172 points or -0.90%
- Russell 2000+ 4.47 points or +0.18%
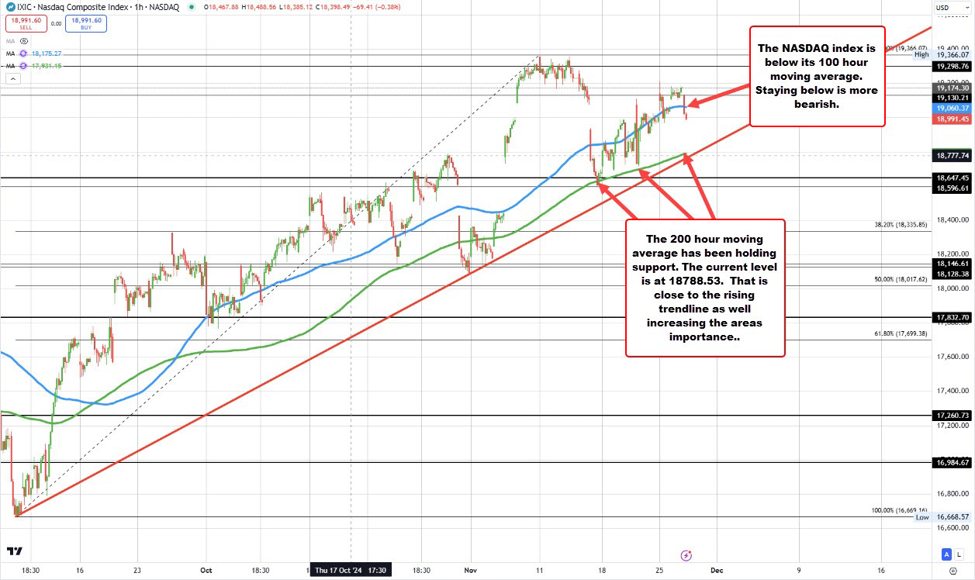
the NASDAQ index has move below its 100 hour moving average. That is nothing new going back to November 14. Nevertheless, it is a tilt to the downside.
The 200-hour moving average has been acting as a support point level (green line on the chart below). That moving average currently comes in at 18788.53. The NASDAQ index is currently trading at 18990.
Dell’s dump is the big drag today after the guidance was weaker than expectations in its earnings release after the close yesterday. Shares are down -$18.52 or -13.09% at $123.16. The low price today reached $121.30 so far.
Looking at the hourly chart, the price gap below its 200 hour moving average of $131.66. Getting back above that level would be needed to tilt the bias back to the upside. Closer resistance comes against a broken 38.2% retracement of the move up from the August low. That level comes in at $124.46.
The 50% midpoint of the move up from the August low comes in at $117.30. That is near the low from October 22 at $117.80
This article was written by Greg Michalowski at www.forexlive.com.
Source link


