- Prior month 2.6% YoY revised to 2.7%
- Ex Food and energy MoM 0.0% vs 0.2% estimate
- Ex Food and energy YoY 2.4% vs 2.7% estimate. Prior month 3.0%
- Ex Food and Energy/Trade 3.3% vs 3.2% (revised from 3.1%
- Ex Food and Energy/Trade MoM 0.3% vs 0.1% last month (revised from 0.0%)
Final Demand for good and services
- Good +0.6%. This was the largest increase since 1.1% in February. Nearly 60% can be attributed to energy which moved up 1.9%
- Services -0.2%. This was a largest decline since March 2023. The decline can be attributed to final demand for trade services which fell -1.3%
Final Demand Goods
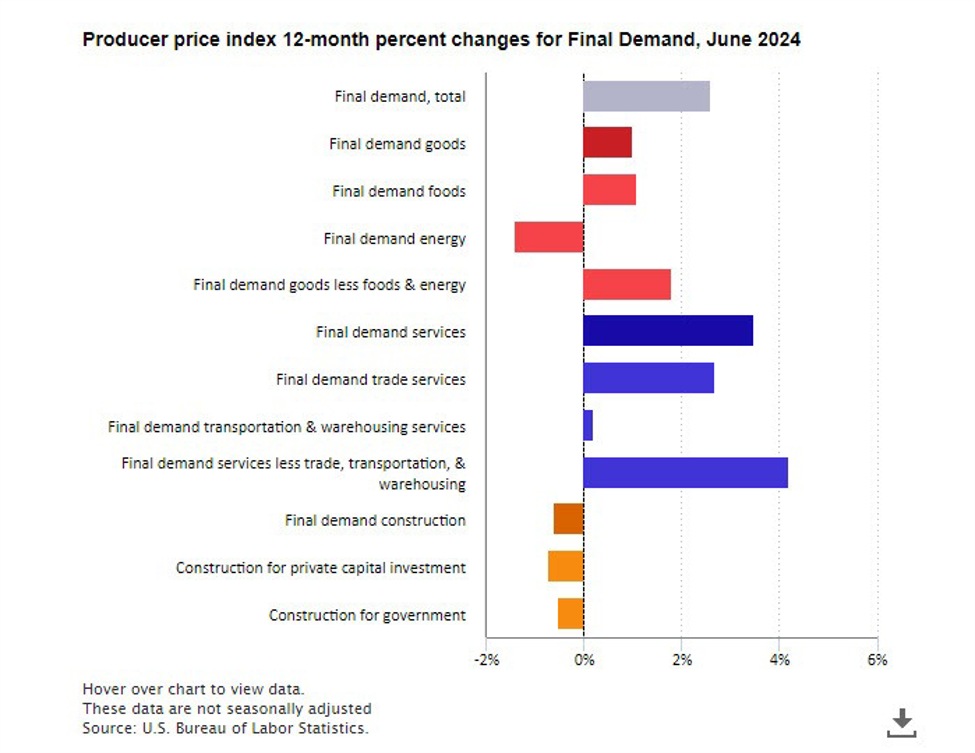
- Prices increased 1.0% over the year.
- Final demand foods increased 1.1%.
- Final demand energy decreased 1.4%.
- Final demand goods less foods and energy increased 1.8%.
Final Demand Services
- Prices increased 3.5% over the year.
- Trade services prices increased 2.7%.
- Transportation and warehousing services prices were nearly unchanged at 0.2%.
- Services less trade, transportation, and warehousing increased 4.2%.
Final Demand Construction
- Prices decreased 0.6% over the year.
The data should be good for the PCE data released later this month (some components feed into the PCE. The CPI data will be released tomorrow. Today’s data does not necessarily influence the CPI data.yields
Yields have moved lower with the 10 year down -2.6% at 3.882%. The 2-year is down four basis points at 3.975%. The US dollar is lower as well.
The US stocks in premarket trading have moved higher
- Dow Industrial Average is up96 points
- S&P index is up 30 points
- NASDAQ index is up 152 points
.
This article was written by Greg Michalowski at www.forexlive.com.
Source link


