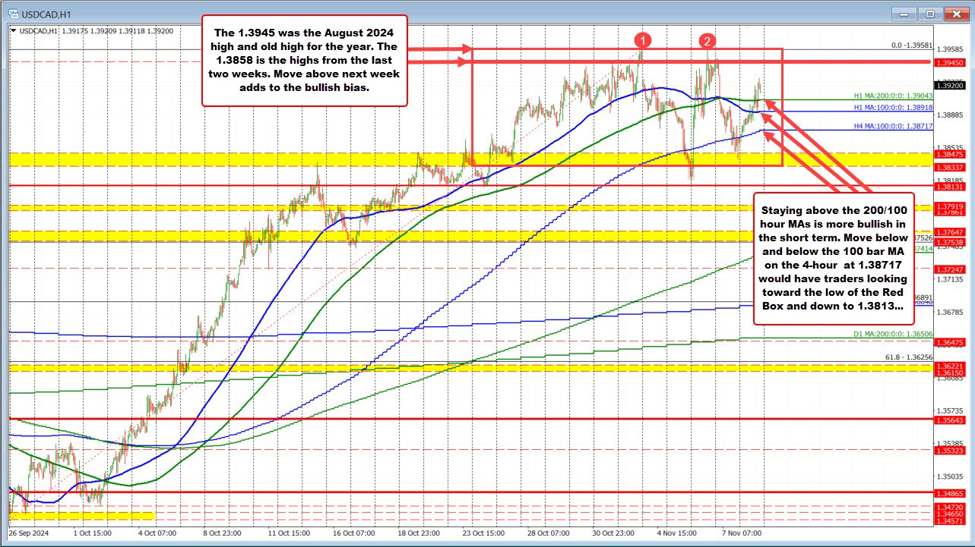
The USDCAD remained (for the most part) this week in a range between 1.38337 on the downside and 1.3958 on the topside. The topside is defined by the high from last Friday and the high from the US election buying. Both those highs took out the August high at 1.3945. Both of those levels are key resistance targets that will need to be broken to increase the bullish bias.
A move above would have the pair trading at the highest level going back to October 2022 at 1.3977. Get above that level and the price is trading at the highest level going back to 2020.
On the downside, there is mid-range support defined by the 100 and 200 hour moving averages. The 100 hour moving average comes in at 1.38918. The 200 hour moving average comes at 1.39043. In trading in the North American session, the low price stalled right near the 100 hour moving average and bounced higher.
Next week, if the price were to move below the 100 hour moving average, it would tilt take short-term bias to the downside and have traders looking toward the 100 bar moving average on a four hour chart at 1.38717. Below that, and traders would look toward the swing area between 1.3833 and 1.3847. The low for this week reached 1.3823. That was just above swing lows from October 21, October 22, and October 24 at 1.38131.
For now, the buyers are more in control above the 100 and 200 hour moving averages with traders looking at the wider swing lows and swing highs seen over the last few weeks of trading.
This article was written by Greg Michalowski at www.forexlive.com.
Source link


