
Fundamental
Overview
The S&P 500 reached a
new all-time high last Friday despite the higher-than-expected US
CPI and PPI
reports. The Fed targets the PCE though and the Core PCE Y/Y is now expected to
tick lower to 2.6%.
The market has now priced
out the aggressive rate cuts expectations and it’s almost perfectly in line
with the Fed’s projections. Therefore, we will continue to see rate cuts into a
resilient economy, which is a bullish driver for the stock market.
Also, as a reminder, the
Fed’s reaction function has changed, so stronger data will just potentially cause
a pause in the easing cycle at most. They are not even thinking about
tightening anymore. The next big risk event for the market will be the US election
in November.
S&P 500
Technical Analysis – Daily Timeframe
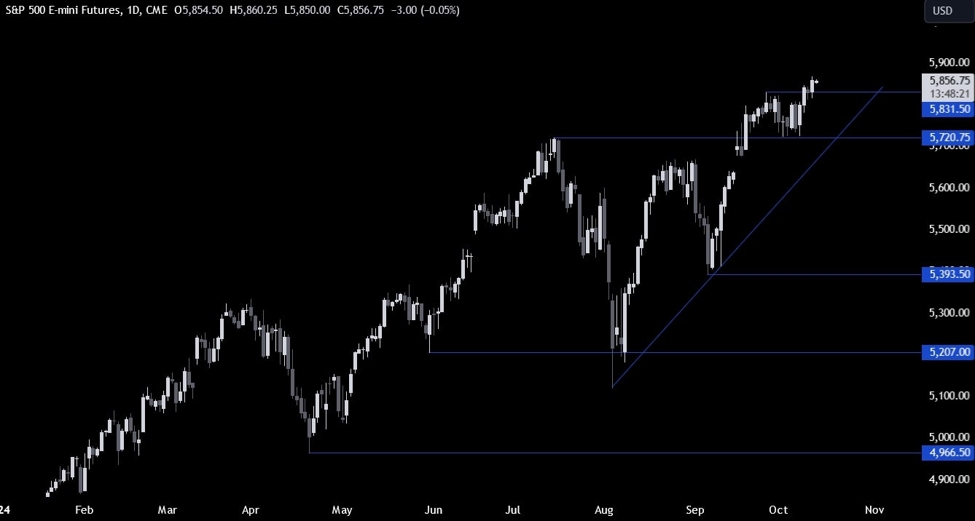
On the daily chart, we can
see that the S&P 500 rallied to a new all-time high last Friday as the
market continues to push higher on the Fed cutting rates into a resilient
economy.
If we get a deeper
pullback, we can expect the buyers to lean on the trendline
with a defined risk below it to position for a rally into a new all-time high.
The sellers, on the other hand, will want to see the price breaking below the
trendline to start targeting a drop into the 5400 level.
S&P 500 Technical
Analysis – 4 hour Timeframe
On the 4 hour chart, we can
see that we recently had some consolidation around the previous all-time high
but eventually the price rallied into a new high. We now have a strong support
zone around the 5820 level where we can find the swing low and the 38.2% Fibonacci
retracement level.
If the price pulls back
into the support, we can expect the buyers to step in with a defined risk below
the swing low to position for a rally into a new all-time high. The sellers, on
the other hand, will want to see the price breaking lower to pile in for a drop
into the 5720 level.
S&P 500 Technical
Analysis – 1 hour Timeframe
On the 1 hour chart, we can
see that we have a minor support zone around the 5845 level where we can find
the confluence
of the minor upward trendline and the previous resistance
now turned support.
This is where we can expect
the buyers to step in with a defined risk below the trendline to position for more
upside, while the sellers will look for a break lower to target a drop into the
5820 support. The red lines define the average daily range for today.
Upcoming
Catalysts
This week is pretty empty on the data front with just a couple of key economic
releases. Today, we have Fed’s Waller speaking, while on Thursday, we get the
US Retail Sales and US Jobless Claims data.
This article was written by Giuseppe Dellamotta at www.forexlive.com.
Source link