
Fundamental
Overview
At one point it looked like the worst was behind us as the S&P 500 rallied
almost 3% on a single day following the BoJ and FOMC decisions.
Unfortunately, the following day we got an ugly US ISM Manufacturing PMI which sent the market
into risk-off and defensive positioning into the US NFP report.
The US Jobs report didn’t help as the data
surprised to the downside with unemployment jumping to a totally unexpected
4.3% rate. The losses extended and eventually we got a strong overnight selloff
today due to spillover effects as the Nikkei crashed 12% in a single day.
The market is now pricing in 125 bps of easing by year-end which translates
into a 50 bps cut in both September and November, and a 25 bps cut in December.
The market is even seeing small chances of an inter-meeting cut. Things are
moving quickly.
S&P 500
Technical Analysis – Daily Timeframe
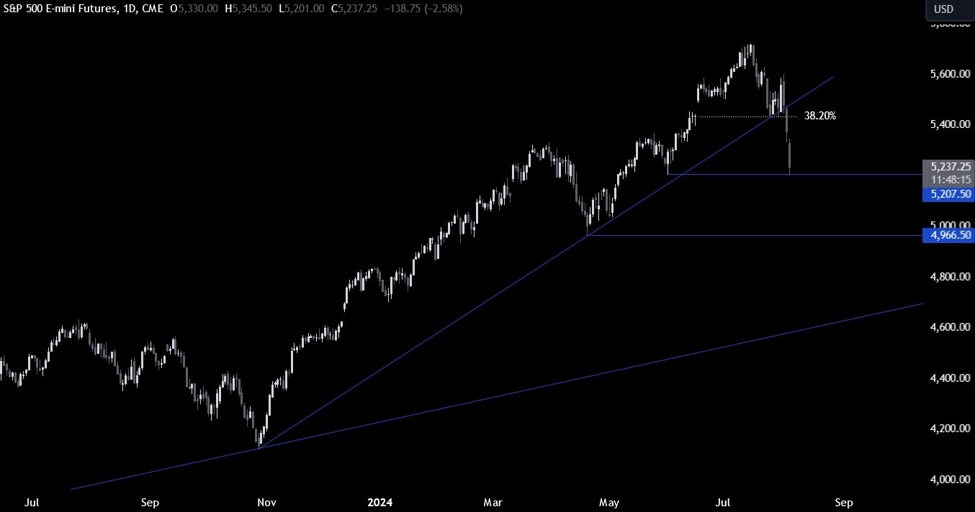
On the daily chart, we can
see that the S&P 500 broke through the major trendline around the 5435 level where we had
also the 38.2% Fibonacci retracement level for confluence. The sellers piled in more
aggressively as the buyers folded. We are now seeing a bounce on a previous
swing low level around the 5200 level.
This is where we can expect
the buyers to step in with a defined risk below the level to position for a
rally into the 5400 level. The sellers, on the other hand, will want to see the
price breaking lower to increase the bearish bets into the 5000 level next.
S&P 500 Technical
Analysis – 4 hour Timeframe
On the 4 hour chart, we can
see that we got a fakeout last week when the price broke above the 5540
resistance and then dropped back below it as the US ISM Manufacturing PMI
missed expectations by a big margin. There’s not much else we can glean from
this timeframe as the buyers will just look for a bigger bounce, while the
sellers will look for a break below the 5200 level to extend the drop.
S&P 500 Technical
Analysis – 1 hour Timeframe
On the 1 hour chart, we can
see that we have a minor downward trendline defining the current bearish
momentum. The buyers will want to see the price breaking higher to increase the
bullish bets into the 5400 level, while the sellers will likely keep on leaning
on it to position for a break below the 5200 level. The red lines define the average daily range for today.
Upcoming
Catalysts
This week is basically empty on the data front. Today we have the US ISM Services
PMI and on Thursday we get the latest US Jobless Claims figures. The market
will also pay close attention to Fed members’ comments given the latest
developments.
This article was written by Giuseppe Dellamotta at www.forexlive.com.
Source link