
Fundamental
Overview
This week the growth fears came
back as the we got a couple of soft US data. Most of the weakness can be
attributed to the ISM
Manufacturing PMI which disappointed as it missed expectations, and the new
orders index dropped further into contraction.
Overall, the report was much
better than the prior month, but it looks like the market wants to err on the
defensive side heading into the NFP report tomorrow. We also got the US
Job Openings data yesterday, but it was July’s data which was bad for many
other indicators as it looks like short term factors negatively affected the
data.
We are going into the NFP
report with a 50/50 chance of either a 25 bps or 50 bps cut at the upcoming
meeting, so the data tomorrow will decide by how much the Fed is going to cut.
In today’s context though,
weaker labour market data and the prospect of a 50 bps cut might not be enough
to lift the stock market and could actually lead to more downside on
recessionary fears, so that’s something to keep in mind.
S&P 500
Technical Analysis – Daily Timeframe
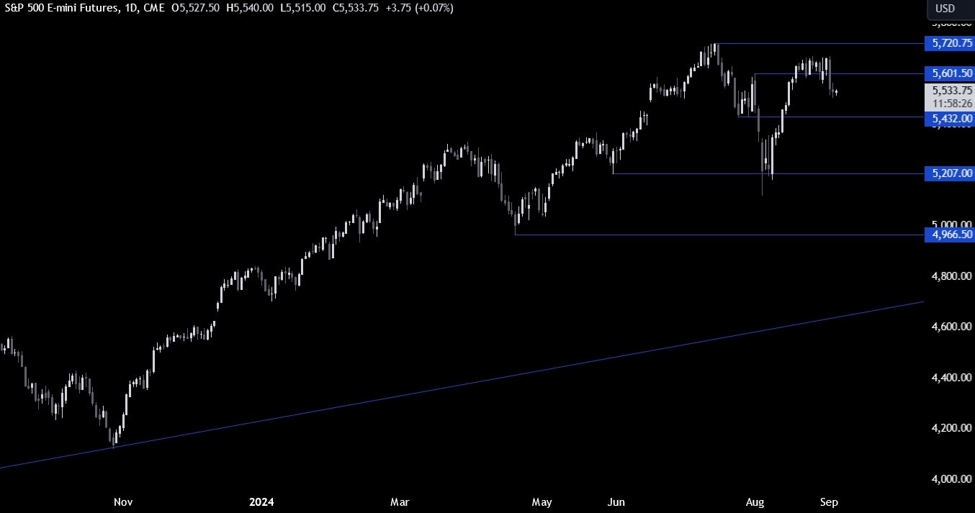
On the daily chart, we can
see that the S&P 500 eventually couldn’t break above the 5665 level and
fell into new lows as the sellers piled in on a key breakout on the lower
timeframe and the ISM Manufacturing PMI missed expectations. There’s not much
we can glean from this chart as the market is just waiting for the NFP report.
S&P 500 Technical
Analysis – 4 hour Timeframe
On the 4 hour chart, we can
see more clearly the failure to break above the 5665 level and then the break
below the trendline which triggered more selling pressure. The price is now
consolidating between the 5506 and 5560 levels. The buyers will want to see the
price breaking higher to position for a rally into the 5665 level, while the
sellers will look for a break lower to increase the bearish bets into the 5432
level.
S&P 500 Technical
Analysis – 1 hour Timeframe
On the 1 hour chart, we can
see more clearly the rangebound price action as we await the NFP release. Today
we will also get other labour market data but unless we get big surprises, it’s
unlikely to see a breakout today. The red lines define the average daily range for today.
Upcoming
Catalysts
Today we have the US ADP, the US Jobless Claims and the US ISM Services PMI.
Tomorrow, we conclude the week with the US NFP report.
This article was written by Giuseppe Dellamotta at www.forexlive.com.
Source link