
Fundamental
Overview
This week has been pretty
boring all around as the lack of catalysts kept the price action confined in a
tight range. The market is waiting for the key economic releases next week as
we will get the ISM PMIs and lots of US labour market data including the NFP
report.
As a reminder, the Fed is
now very focused on the labour market as Fed Chair Powell said that they will
not welcome any more weakness and will do everything they can to keep it
strong. Therefore, the data will decide whether the central bank will go with a
standard 25 bps cut in September or take a more aggressive approach with a 50
bps cut.
In today’s context though,
weaker labour market data and the prospect of a 50 bps cut might not be enough
to lift the stock market and could actually lead to more downside on
recessionary fears, so that’s something to keep in mind.
S&P 500
Technical Analysis – Daily Timeframe
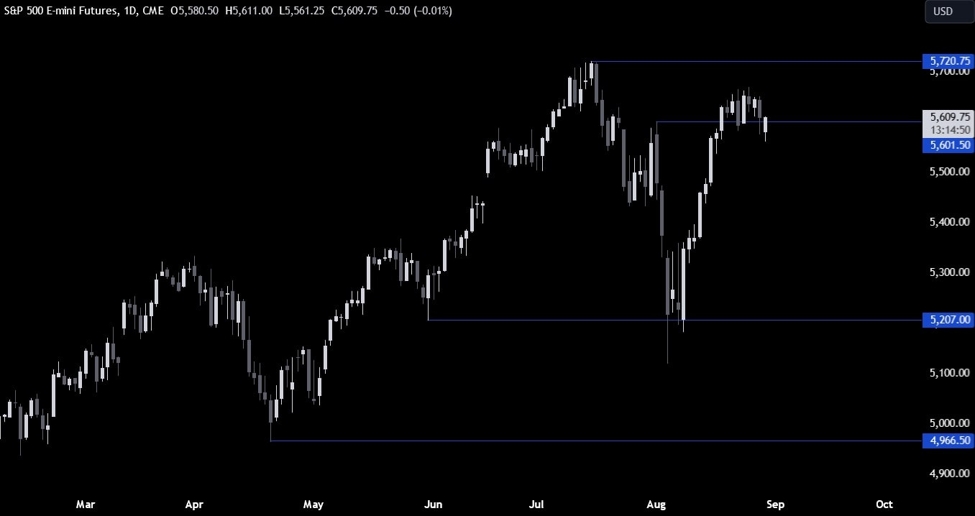
On the daily chart, we can
see that the S&P 500 briefly broke below the 5600 level but eventually rallied
back above it. That’s been a key level as the market got stuck in a
consolidation awaiting the key economic releases next week. It should act as
kind of a barometer for the sentiment with the price staying above it being
more bullish and staying below it being more bearish.
S&P 500 Technical
Analysis – 4 hour Timeframe
On the 4 hour chart, we can
see that we got a perfect bounce on the key trendline around the 5560 level tonight as
the dip-buyers piled in with a defined risk below it. The sellers will want to
see the price breaking below the trendline to gain some control and position
for a drop into the 5350 level next.
S&P 500 Technical
Analysis – 1 hour Timeframe
On the 1 hour chart, we can
see more clearly the rangebound price action that’s been going on since last
week. We have a strong resistance
now around the 5660 level where the price got rejected from several times.
A break above that
resistance should see the buyers increasing their bullish bets into a new
all-time high. The sellers, on the other hand, will likely step in around the
resistance with a defined risk above it to position for a break below the trendline
and new lows. The red lines define the average daily range for today.
Upcoming
Catalysts
Today we get the latest US Jobless Claims figures, while tomorrow we conclude
the week with the US PCE report.
This article was written by Giuseppe Dellamotta at www.forexlive.com.
Source link