
Fundamental
Overview
Last Friday, the Russell
2000 sold off following the weaker than expected NFP
report even though the details were better than the prior month. The
technical break below the key support around the 2120 level eventually increased
the bearish momentum.
The market has become very
sensitive to soft growth and labour market data. There’s also a good argument
that the market wants the Fed to deliver bigger cuts to avoid that the soft
landing turns into a hard landing.
The chances for a 50 bps
cut increased yesterday following the drop in Treasury yields after a weaker US NFIB Small Business Optimism Index and BoC’s Macklem comments on bigger cuts with people
wondering whether the bond market is signalling more economic weakness ahead.
Russell 2000
Technical Analysis – Daily Timeframe
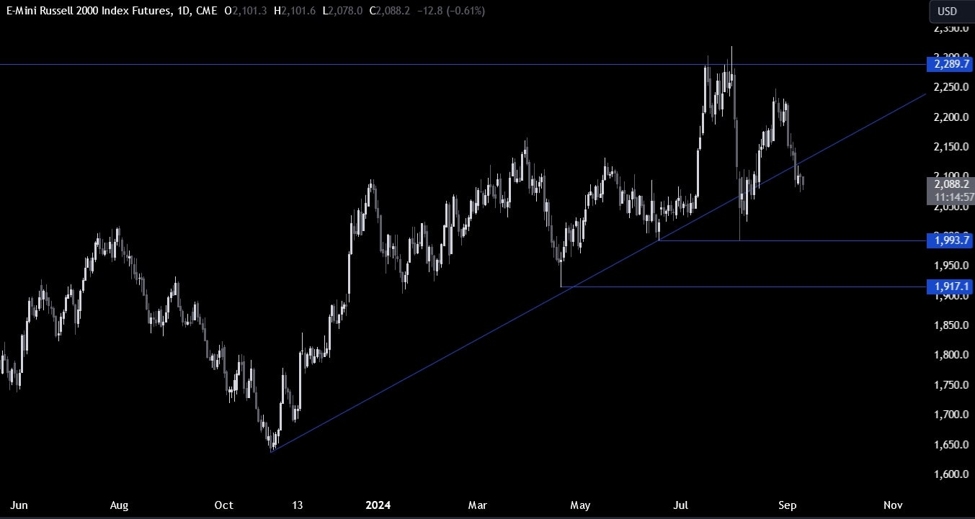
On the daily chart, we can
see that the Russell 2000 dropped back below the major trendline following the US NFP release. The
sellers took back control and they will now target a fall into the 1993 level.
The buyers, on the other hand, will need the price to rally back above the
trendline to start targeting new highs.
Russell 2000 Technical
Analysis – 4 hour Timeframe
On the 4 hour chart, we can
see that the price broke through the strong support zone around the 2120 level
where we had the confluence of the trendline and the previous resistance turned support. The sellers piled in on a break
lower to position for a drop into the 1993 level, while the buyers folded waiting
for new opportunities. A rally back above the resistance should give the buyers
some control and increase the bullish momentum into new highs.
Russell 2000 Technical
Analysis – 1 hour Timeframe
On the 1 hour chart, we can
see that we have a downward trendline defining the current bearish momentum.
The sellers will likely keep on leaning on the trendline to position for more
downside, while the buyers will want a break to the upside to start piling in
for a break above the resistance. The red lines define the average daily range for today.
Upcoming
Catalysts
Today we get the US CPI report. Tomorrow, we have the latest US Jobless
Claims figures and the US PPI data. On Friday, we conclude the week with the
University of Michigan Consumer Sentiment report.
This article was written by Giuseppe Dellamotta at www.forexlive.com.
Source link