
Fundamental
Overview
Yesterday, we got two
strong US data releases as the Jobless Claims and Retail Sales figures came out much better than
expected. The initial reaction was US Dollar bullish, but after a while the
market started to fade the move.
The reason is that the
risk-on sentiment is generally negative for the greenback as the market focuses
on positive global growth. Of course, the reasons to sell the USD are not that
strong and that’s why in the big picture the major currency pairs have been
mostly trading in a range for a year.
But in the short term, the
changes in sentiment are influencing the price action and the US Dollar
performance.
On the NZD side, this
week the RBNZ cut rates by 25 bps. While analysts and economist
were expecting the OCR to remain unchanged, the market was pricing more than a
70% probability of a rate cut nonetheless, so it wasn’t such a big surprise.
What weighed on the Kiwi
were more dovish than expected central bank’s forecasts for future interest
rates settings.
NZDUSD
Technical Analysis – Daily Timeframe
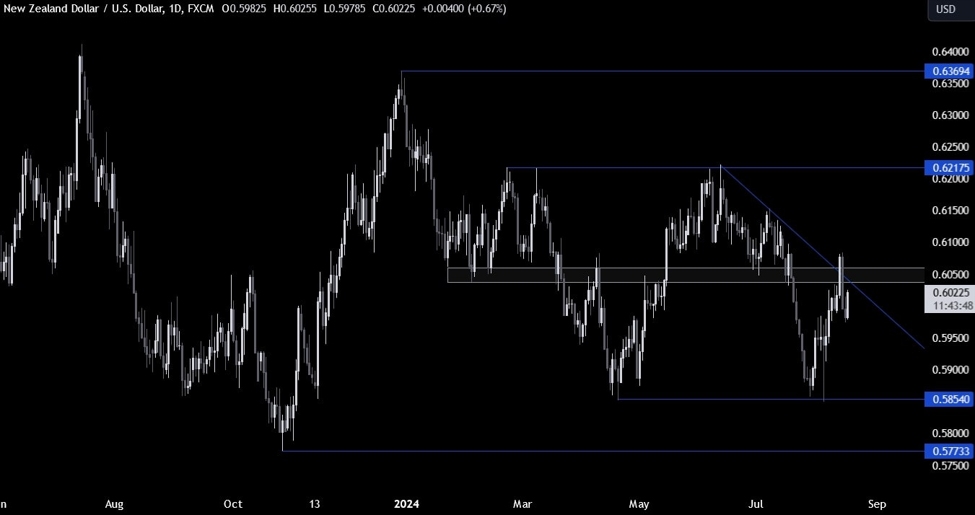
On the daily chart, we can
see that NZDUSD probed above the key resistance zone this week around the 0.6050
level but got smacked back down following the rate cut from the RBNZ. The
buyers found support around the 0.5980 level and started to pile in following
the much better than expected US data.
A break above the 0.6050 resistance
should see the buyers increasing the bullish bets into the 0.6217 level. The
sellers, on the other hand, should step back in around the resistance to
position for a drop into the 0.5850 level next.
NZDUSD Technical
Analysis – 4 hour Timeframe
On the 4 hour chart, we can
see more clearly the bounce from the minor support zone around the 0.5980 level
where the price got rejected from several times in the past weeks. The sellers
will want to see the price breaking below that level to increase the bearish
bets into the 0.5850 level.
NZDUSD Technical
Analysis – 1 hour Timeframe
On the 1 hour chart, we can
see that we have the upper bound of the average daily range for today standing right around the
key resistance zone. Therefore, it’s unlikely that we will get a breakout today
unless the US data today comes out very strong.
Upcoming
Catalysts
Today we conclude the week with the University of Michigan Consumer Sentiment
survey.
This article was written by Giuseppe Dellamotta at www.forexlive.com.
Source link