Fundamental
Overview
The USD got a boost
recently from another set of hot data as the US Job Openings surprised to the upside and the
prices paid index in the ISM Services PMI jumped to the highest level since
2023.
The market’s pricing didn’t
change much though and Fed’s Waller yesterday kept the rate cuts hopes alive
saying that the pace will be driven by inflation progress. Since the central
bank has switched its focus back to inflation, the US CPI report next week
should have a bigger influence on interest rates expectations than the US NFP
tomorrow (barring big deviations).
On the NZD side, the RBNZ cut interest rates by 50 bps as expected at
the last meeting. We haven’t got any fresh New Zealand data in the meantime,
but the market continues to price in a 76% chance of a 50 bps cut in February
and a total of 124 bps of easing by year end.
NZDUSD
Technical Analysis – Daily Timeframe
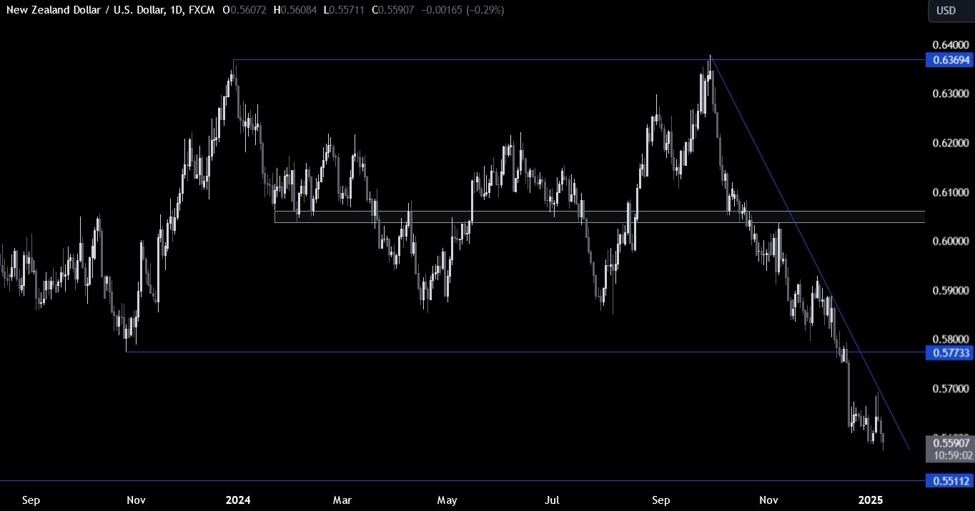
On the daily chart, we can
see that NZDUSD is consolidating near the recent lows with the 2022 low around
the 0.5511 level now being very close. We have a downward trendline
defining the bearish momentum. The sellers will likely continue to lean on it
to position for further downside, while the buyers will look for a break higher
to start targeting new highs.
NZDUSD Technical
Analysis – 4 hour Timeframe
On the 4 hour chart, there’s
not much else we can add here as the price action remains mostly rangebound as we
continue to wait for the US NFP and CPI reports. The resistance
zone around the 0.5670 level will be a key level to look at if we get there in
the next days.
NZDUSD Technical
Analysis – 1 hour Timeframe
On the 1 hour chart, we can
see that the price is trading at the support zone around the 0.5590 level. The
buyers will likely step in here to position for the rally into the resistance
zone, while the sellers will look for the price to stay below the support to
keep pushing towards the 2022 lows. The red lines define the average daily range for today.
Upcoming
Catalysts
Tomorrow, we conclude the week with the US NFP report.
This article was written by Giuseppe Dellamotta at www.forexlive.com.
Source link


