
Fundamental
Overview
The USD continues to reign
supreme despite the lack of catalysts. The main culprit for the recent strength
in the US Dollar has been the rally in long term Treasury yields. The yield
curve is bear flattening which is what you would expect with higher growth and
potentially higher inflation expectations.
The catalyst for this was
of course the latest FOMC decision and the US NFP report added fuel to the
fire. There’s also been a good argument that the markets are already
positioning for a Trump victory which is expected to strengthen the higher
growth and less rate cuts expectations.
For now, this is the trend
and it’s generally a bad idea to fight such trends without a catalyst.
Unfortunately, we don’t have much left for October as the main events will be
in the first weeks of November when we will get the top tier economic reports,
the US elections and the FOMC decision.
On the NZD side, the latest
New Zealand Q3 CPI missed expectations solidifying the
market’s view for another 50 bps cut at the upcoming meeting and even pricing 26%
chance of a 75 bps move. In 2025, the market expects four more 25 bps cuts.
NZDUSD
Technical Analysis – Daily Timeframe
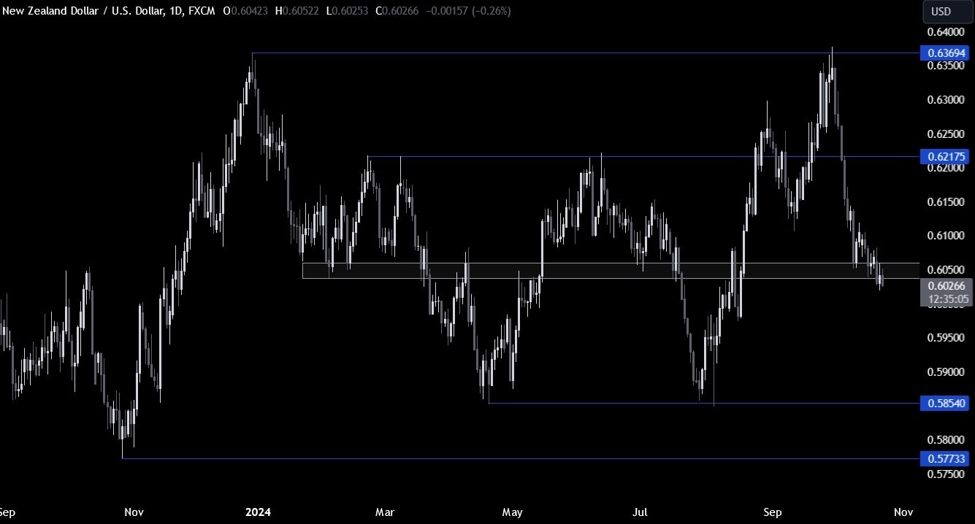
On the daily chart, we can
see that NZDUSD is slowly breaking below the key 0.6050 support zone. The bearish momentum has slowed down, but
the sellers will likely pile in around these levels to keep pushing into the
0.5850 level next. The buyers, on the other hand, will want to see a bounce to
start targeting the 0.6217 resistance.
NZDUSD Technical
Analysis – 4 hour Timeframe
On the 4 hour chart, we can
see that the recent price action has formed a falling
wedge which is generally a signal of a loss of momentum and potential
reversal. The sellers will want to see the price breaking below the bottom trendline
to increase the bearish bets into new lows. The buyers, on the other hand, will
look for a break above the top trendline to pile in for a rally into the 0.6217
resistance.
NZDUSD Technical
Analysis – 1 hour Timeframe
On the 1 hour chart, there’s
not much more we can add as buyers and sellers will look for breakouts. Nonetheless,
we can expect some aggressive buyers to step in around the bottom trendline to
position for a rally into the top trendline. The red lines define the average daily range for today.
Upcoming
Catalysts
Tomorrow we get the US Flash PMIs and the US Jobless Claims figures.
This article was written by Giuseppe Dellamotta at www.forexlive.com.
Source link