
Fundamental
Overview
At one point it looked like the worst was behind us as the Nasdaq rallied
almost 5% in a single day following the BoJ and FOMC decisions.
Unfortunately, the following day we got an ugly US ISM Manufacturing PMI which sent the market
into risk-off and defensive positioning into the US NFP report.
The US Jobs report didn’t help as the data
surprised to the downside with unemployment jumping to a totally unexpected
4.3% rate. The losses extended and eventually we got a strong overnight selloff
yesterday as Nikkei crashed 12% in a single day.
At the peak of the risk
aversion yesterday the markets saw the Fed cutting rates by 136 bps by year-end
and some chances of an emergency rate cut. Fear is generally a stronger emotion
than greed in the markets. Although the volatility calmed down a bit, the
markets are still expecting a 50 bps cut by the Fed in September and a total of
110 bps by year-end.
Nasdaq
Technical Analysis – Daily Timeframe
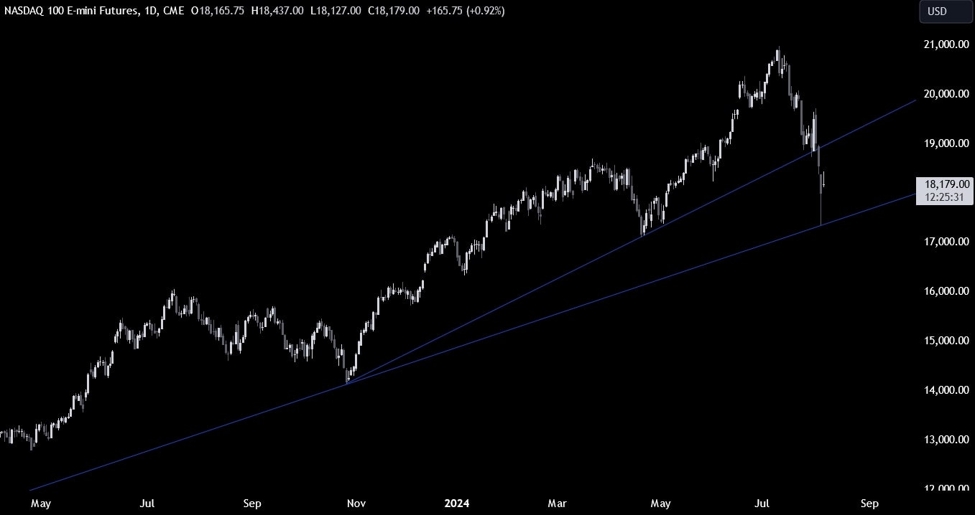
On the daily chart, we can
see that the Nasdaq eventually broke through the trendline around the 18900 level and extended
the selloff into the next major trendline around the 17400 level. That’s where
the buyers stepped in with a defined risk below the trendline to position for a
rally into new highs. The sellers will need the price to break below the
trendline to increase the bearish bets into 16000 level next.
Nasdaq Technical
Analysis – 4 hour Timeframe
On the 4 hour chart, we can
see that we got a fakeout last week when the price broke above the 19300
resistance and the trendline but then dropped back below it as the US ISM
Manufacturing PMI missed expectations by a big margin.
From a risk management
perspective, the sellers will have a better risk to reward setup around the
recent swing low at 18800 where we can also find the 61.8% Fibonacci
retracement level for confluence.
The buyers, on the other hand, will want to see the price breaking above the
18800 resistance
and rising above the previous trendline to gain even more confidence and
increase the bullish bets into new highs.
Nasdaq Technical
Analysis – 1 hour Timeframe
On the 1 hour chart, we can
see that the price has been printing higher highs and higher lows on this
timeframe as the buyers piled in around the major trendline. At the moment, we
are seeing some weakness but if the price were to drop all the way back to the
17900 support, we can expect the buyers to step in with a defined risk below
the support to position for a rally into the 18800 level.
The sellers, on the other
hand, will want to see the price breaking below the support to pile in and
position for a break below the major trendline. The red lines define the average daily range for today.
Upcoming Catalysts
This week is basically empty on the data front. The only notable economic release
will be on Thursday when we get the latest US Jobless Claims figures. The
market will also pay close attention to Fed members’ comments given the latest
developments in the markets.
This article was written by Giuseppe Dellamotta at www.forexlive.com.
Source link