
Fundamental
Overview
The Nasdaq has been on a steady rise ever since the last week’s US Jobless
Claims as the data quelled the fears around the labour market following the
weak NFP report. The “growth scare” triggered by the ugly ISM Manufacturing PMI
and the weak NFP report looks to be behind us for now.
This week we got some more positive news on the inflation front as the US PPI surprised to the
downside and the US CPI yesterday showed some
more easing. That should be good news as the Fed will likely be even more
dovish from now on and the chances of three rate cuts by year-end solidify.
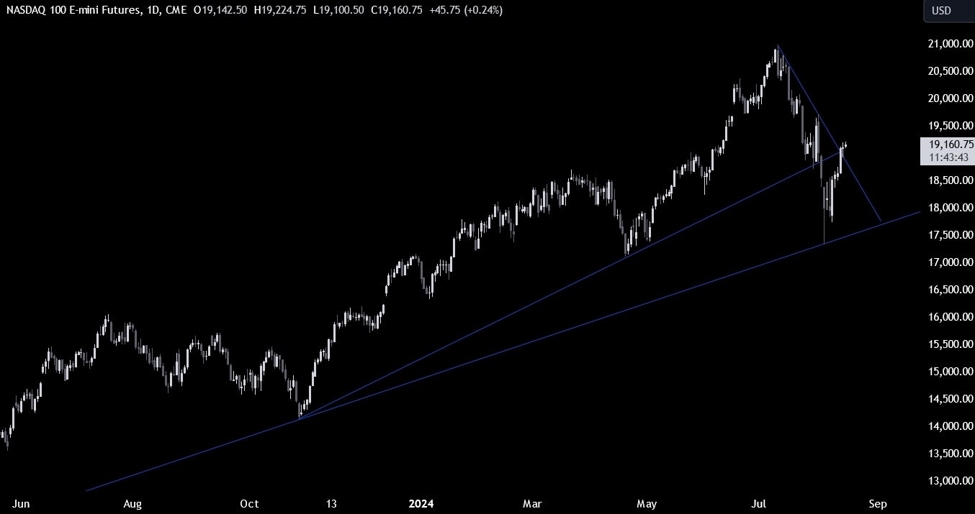
Nasdaq
Technical Analysis – Daily Timeframe
On the daily chart, we can
see that the Nasdaq broke above the key trendline around the 19000 level this week. This
should give the buyers a bit more confidence to increase the bullish bets into
new highs. The sellers, on the other hand, will want to see the price falling
back below the trendline to regain some control and position for a drop into the
17500 level.
Nasdaq Technical Analysis – 4 hour Timeframe
On the 4 hour chart, we can
see that we have a notable support zone around the 18800 level which saw the
bearish momentum increasing on the way down and the bullish momentum increasing
on the way up.
If the price were to fall
back into the support zone, we can expect the buyers to step in with a defined
risk below the zone to position for a rally into the 19727 level. The sellers,
on the other hand, will want to see the price breaking lower to position for a
drop into the 17500 level.
Nasdaq Technical
Analysis – 1 hour Timeframe
On the 1 hour chart, we can
see that we have a minor upward trendline defining the current bullish
momentum. The buyers will likely keep on leaning on the trendline to position
for new highs, while the sellers will want to see the price breaking lower to
target a drop into the 18800 support. The red lines define the average daily range for today.
Upcoming Catalysts
Today we get the US Retail Sales and Jobless Claims figures. Tomorrow, we
conclude the week with the University of Michigan Consumer Sentiment survey.
This article was written by Giuseppe Dellamotta at www.forexlive.com.
Source link