
Fundamental
Overview
The Nasdaq has been on a steady decline since the last US CPI report on
July 11th. In the first stages of the pullback, we’ve been seeing a
rotation from big cap stocks into small cap stocks as the Russell 2000
displayed an opposite price action. Eventually, the bearish momentum picked up
and we saw a more aggressive decline with the index falling by 10%.
A good argument
has been that most of the moves we’ve been seeing in the past 10 trading days
were driven by deleveraging from strengthening Yen. Basically, the squeeze on
the carry trades impacted all the other markets. Given the magnitude of the
recent appreciation in the Yen and the correlation with many other markets, it
looks like this could be the reason indeed.
If that’s the case, we could see the market getting back to the old script
with the BoJ Policy Decision likely acting as a catalyst on Wednesday. In fact,
from a big picture perspective, nothing has changed as the market continues to expect at least two rate
cuts by the end of the year and sees some chances of a back-to-back cut in
November.
The data continues to suggest that the US economy remains resilient with
inflation slowly falling back to target. Overall, this should continue to
support the soft-landing narrative and be positive for the general risk
sentiment as the Fed is going to cut rates into resilient growth.
Nasdaq
Technical Analysis – Daily Timeframe
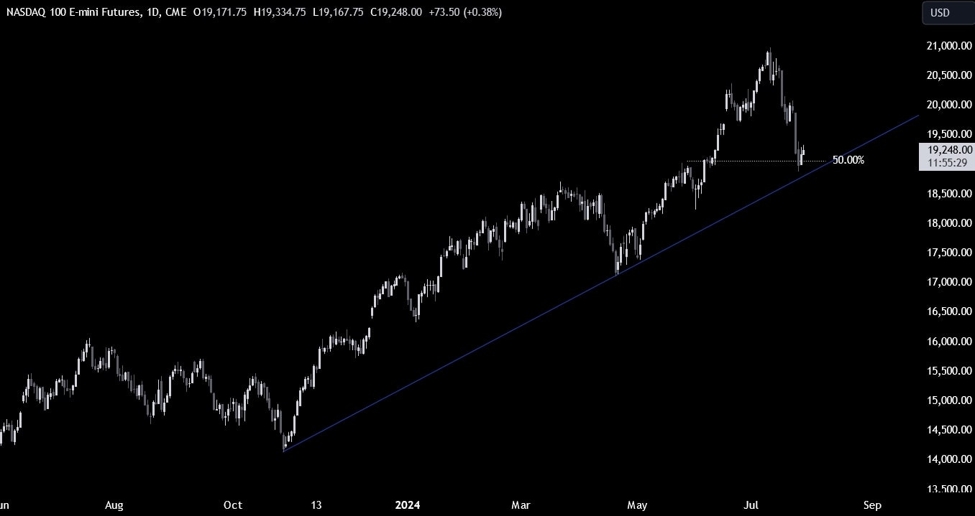
On the daily chart, we can
see that the Nasdaq eventually pulled all the way back to the major trendline around the 18900 level where we had
also the 50% Fibonacci retracement level for confluence. The buyers stepped in with a
defined risk below the trendline to position for a rally into a new all-time
high. The sellers will need the price to break below the trendline to increase
the bearish bets into new lows.
Nasdaq Technical
Analysis – 4 hour Timeframe
On the 4 hour chart, we can
see that we have a downward trendline defining the current bearish momentum. If
the price rallies into the trendline, we can expect the sellers to lean on it
to position for a break below the major trendline with a better risk to reward
setup. The buyers, on the other hand, will want to see the price breaking above
the trendline to increase the bullish bets into a new all-time high.
Nasdaq Technical
Analysis – 1 hour Timeframe
On the 1 hour chart, we can
see that we’ve been recently printing higher highs and higher lows on this
timeframe as the bullish momentum started to pick up. If the price drops back
into the major trendline, we can expect the buyers to buy back the dip again. The
sellers, on the other hand, will look to sell around the downward trendline or
increase the bearish bets on a break below the major trendline. The red lines
define the average daily range for today.
Upcoming Catalysts
Tomorrow we have the US Job Openings and the US Consumer Confidence reports. On
Wednesday, we have the BoJ Policy Decision, the US Employment Cost Index and
the FOMC Policy Decision. On Thursday, we get the latest US Jobless Claims
figures and the US ISM Manufacturing PMI. Finally, on Friday, we conclude the
week with the US NFP report.
This article was written by Giuseppe Dellamotta at www.forexlive.com.
Source link