The kickstart video for October 2, takes a technical look at the EURUSD, USDJPY and GBPUSD. The ADP jobs report came in stronger than expected and that has the USD moving a touch although the EURUSD and GBPUSD is consolidating and looking for the next shove. The USDJPY is moving higher.
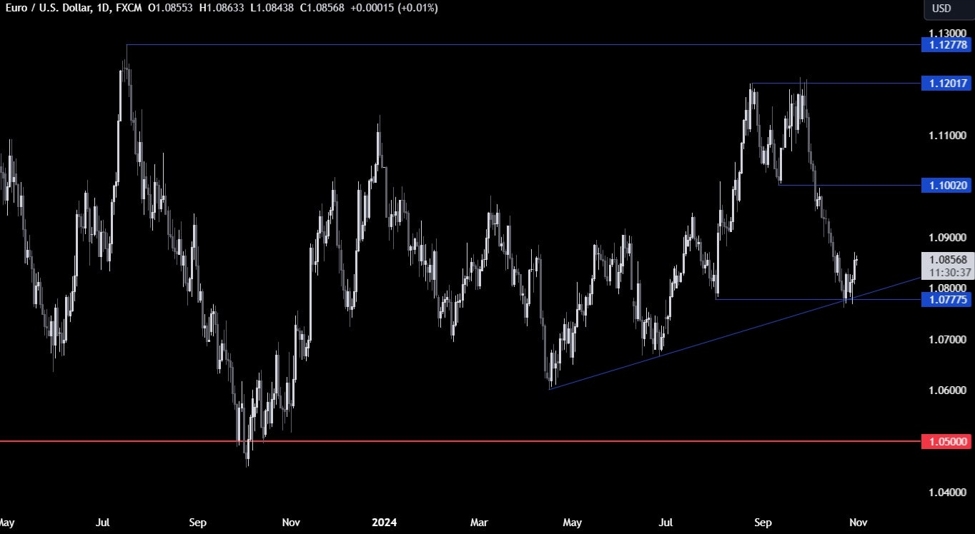
EURUSD: The EURUSD fell sharply yesterday as the USD strengthened helped by the geopolitical concerns out of Israel. Fed Chair Powell has also said this week, that 50 bps in November is not our base case (two 25 basis point cuts remain the expectation data dependent). That helped to send the price of the EURUSD to the downside.Today, however, the ups and downs has gripped the market so far, and stalled the corrective rally near the broken 61.8% of the September range at 1.1082. That level is now the upside close risk (stay below is more bearish). ON the downside, getting below 1.10539 – and staying below that level – would have traders looking toward 1.10258, and then the other lows from September which bottomed near 1.1000.
GBPUSD: The GBPUSD moved sharply lower yesterday as well, and pushed down toward the rising 100 bar moving average on the 4 hour chart. The price did break below that 100 bar MA on the downside momentum, but quickly snapped back higher. The price yesterday closed back above the 38.2% retracement of the September trading range at 1.32683 helping to keep the buyers in play. In trading today, the price has traded mostly above that retracement level. There was a brief look below which could not be sustained. If the downside is to be further explored, getting below the 38.2% retracement and then the rising 100 bar moving average on the 4-hour chart at 1.32535, would be needed to increase the bearish bias.
USDJPY. The USDJPY is the leader today with a run higher which now has the price above the 50% midpoint of the move down from the August high at 144.480. The price is also above the 50% midpoint off the daily chart range since the January 2023 low at 144.58. Stay above those levels is more bullish. On the top side the 61.8% retracement of the move down from the August high at 145.639 is the next target. Get above that level and opens the door toward the high price from last week at 146.51.
This article was written by Greg Michalowski at www.forexlive.com.
Source link


