Gold Price Decline: A Technical Perspective
Gold prices have dropped over $80 today, a decline of 3.00%, marking one of the most significant setbacks for the commodity this year. This comes after five consecutive days of gains last week. The dip coincides with easing geopolitical tensions following discussions of a potential cease-fire between Israel and Lebanon. Despite today’s slide, gold remains up 27.82% year-to-date, on track for its largest annual gain since 2010, when prices surged 29.6%. However, today’s seller momentum raises critical questions about the next moves for gold.
Key Technical Levels to Watch
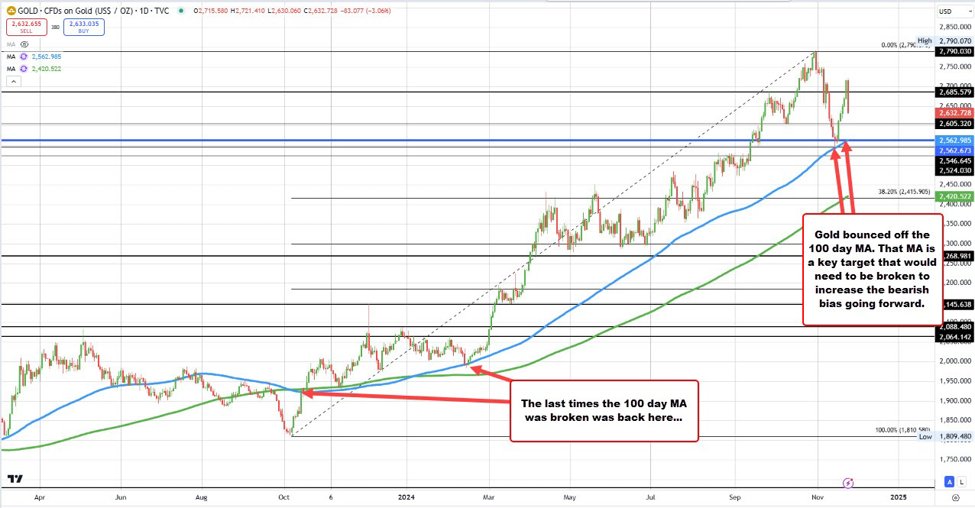
On the downside, the rising 100-day moving average (MA) serves as a crucial support level. Last week, gold’s November lows, reached on November 14 and 15, tested this level before rebounding sharply. That moving average is now a primary downside target, currently around $2562.67. Though gold is still $60+ above this level, its importance as a support zone cannot be overstated. The last sustained trade below the 100-day MA occurred in October 2023, with only brief breaches in mid-February.
What’s Driving Seller Momentum?
On the hourly chart, sellers gained control during the North American session after gold broke below its 100-hour moving average, now sitting at $2662. This level represents a near-term resistance point. A move back above $2662 could undermine today’s bearish technical break, providing buyers an opportunity to reclaim control.
Downside Targets to Monitor
If the bearish momentum persists, the following levels are critical:
- 50% retracement of the November 14 rally: $2628
- 200-hour moving average: $2623.05
- 61.8% retracement: $2606
- 100-day moving average: $2562.67
Sustained trading below the 200-hour MA at $2623.05 would likely embolden sellers, targeting the deeper retracements and, ultimately, the critical 100-day MA.
Outlook
While gold remains in a strong position for the year, technical indicators suggest sellers have the upper hand in the short term. A break below the 100-day moving average could signal a broader shift, but buyers might step in at these key levels to defend the bullish trend. Traders should closely monitor the interplay between these levels and market sentiment to gauge the next move.
This article was written by Greg Michalowski at www.forexlive.com.
Source link


