
Fundamental
Overview
Last Friday, gold spiked to the upside following the US
NFP report. The data showed some more labour market cooling with an
increase in the unemployment rate and a decrease in wage growth. That made the
real yields to drop and gold to accelerate to the upside. This has been the
case for a couple of years now where a rise in real yields sees a much smaller
fall in gold compared to a fall in real yields which triggers a bigger rally in
gold.
As of now, it looks like gold have limited downside but lots of upside as
inflation abates slowly while risks to the growth picture increase the longer
the Fed keeps policy restrictive. In the short-term, strong US data might weigh
a bit on the market, but in the long-term weak data is likely to trigger bigger
upside moves.
Gold
Technical Analysis – Daily Timeframe
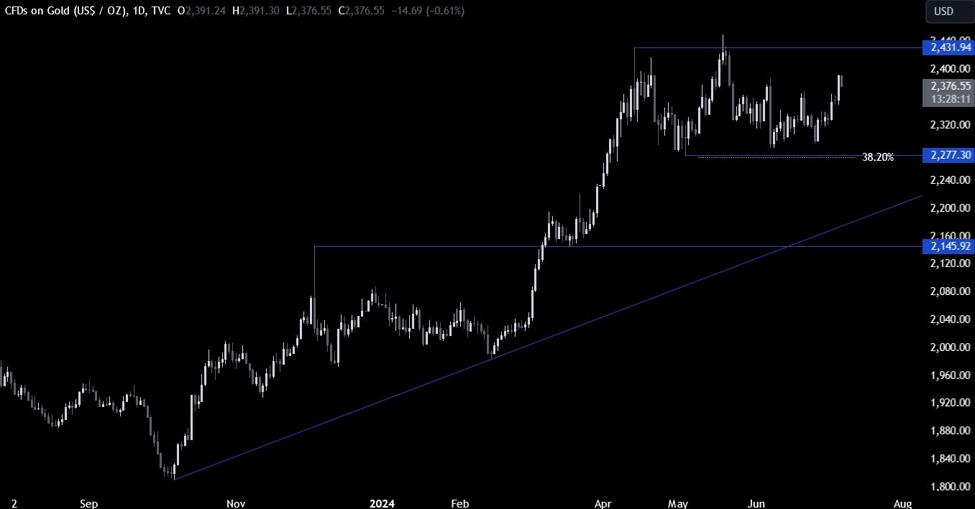
On the daily chart, we can
see that gold has been on a steady rise since bottoming out near the key 2277 support as the buyers piled in around the bottom of
the range and are now looking towards the cycle high around the 2430 level. If
the price gets there, we can expect the sellers to step in around the top of
the range to position for a drop back into the 2277 support targeting a break
below it.
Gold Technical Analysis
– 4 hour Timeframe
On the 4 hour chart, we can
see that the price rallied into the 2387 resistance following the soft US NFP
report and started to pull back. We now have a good support zone around the
2368 level where we can also find the confluence
of the previous swing high, the minor trendline
and the 61.8% Fibonacci
retracement level.
This is where we can expect
the buyers to step in with a defined risk below the trendline to position for a
break above the 2387 resistance. The sellers, on the other hand, will want to
see the price breaking below the trendline to increase the bearish bets into
the 2277 support.
Gold Technical Analysis
– 1 hour Timeframe
On the 1 hour chart, we can
see more clearly the recent price action and the bullish setup around the 2368
level. We can also notice that we have the lower limit of the average daily range for today right around the support,
so that should give the buyers a bit more confidence to pile in around the 2370
level looking for a continuation of the uptrend.
Upcoming
Catalysts
This week is a bit bare on the data front but nonetheless we will have some key
economic releases. Tomorrow, we have Fed Chair Powell testifying to Congress
and the markets will be focused on any view or hint about the monetary policy
trajectory after the recent NFP report. Thursday will be the most important day
of the week as we get the US CPI and the US Jobless Claims figures. Finally, on
Friday, we conclude the week with the US PPI and the University of Michigan
Consumer Sentiment survey.
See the video below
This article was written by Giuseppe Dellamotta at www.forexlive.com.
Source link