
Fundamental
Overview
Gold has been on a steady decline since hitting a new all-time high on the 17th of July. We
saw a reversal in many other markets on that day and although the catalyst hasn’t
been clear it seems like it’s all been connected to deleveraging from
strengthening Yen.
Basically, the squeeze on
the carry trades impacted all the other markets. Given the magnitude of the
recent appreciation in the Yen and the correlation with many other markets, it
looks like this could be the reason indeed.
On the macro side, the US data
continues to point to a resilient economy with inflation falling slowly back to
target. The market is fully pricing a rate cut in September and December and
some chances of a back-to-back cut in November.
The risks for the
economy increase the longer the Fed keeps policy restrictive though, so in the big
picture it looks like gold has limited downside and lots of upside. On the
other hand, we have Trump now looking more and more like a potential winner and
his policies are seen as inflationary which could see the Fed eventually going
even more slowly on rate cuts.
This might not
impact the market substantially in the short term, but it could decrease the
buyers’ conviction for a strong rally.
Gold
Technical Analysis – Daily Timeframe
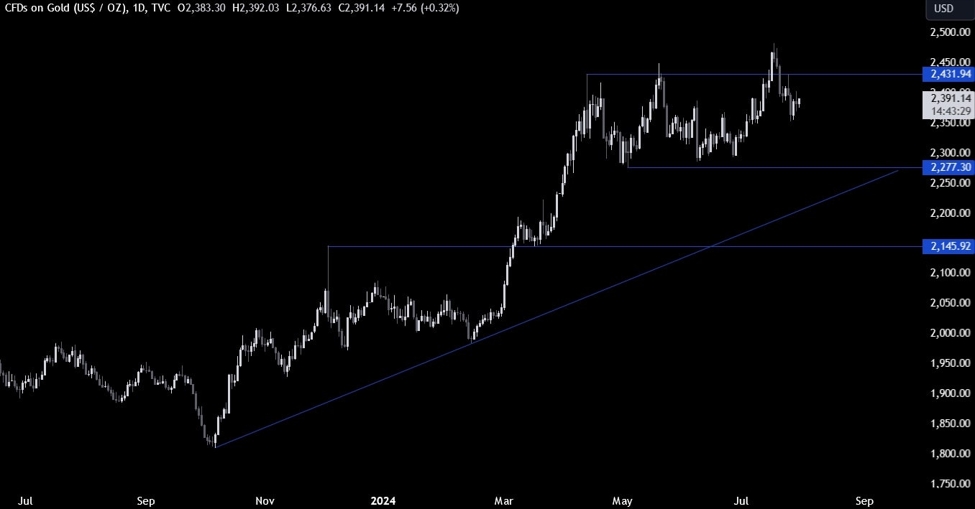
On the daily chart, we can
see that gold eventually extended the losses into the 2350 level after the
fakeout around the 2430 resistance. We are now trading in the middle
of the old range between the 2277 support and the 2430 resistance, so there’s
not much we can glean from this timeframe and we need to zoom in to see some
more details.
Gold Technical Analysis
– 4 hour Timeframe
On the 4 hour chart, we can
see that we have a downward trendline defining the current bearish
momentum. The sellers will likely keep on leaning on the trendline to position
for a drop into new lows with a better risk to reward setup. The buyers, on the
other hand, will want to see the price breaking higher to regain some control
and pile in for a rally into the 2430 resistance.
Gold Technical Analysis
– 1 hour Timeframe
On the 1 hour chart, we can
see more clearly the recent price action and the rejections from the trendline.
This will be the key spot for the buyers and sellers as a break above the
trendline will likely increase the bullish momentum, while a stronger rejection
should see the price dropping back to the 2350 support. The red lines define
the average daily range for today.
Upcoming
Catalysts
Today we have the US Job Openings and the US Consumer Confidence reports.
Tomorrow, we have the BoJ Policy Decision, the US Employment Cost Index and the
FOMC Policy Decision. On Thursday, we get the latest US Jobless Claims figures
and the US ISM Manufacturing PMI. Finally, on Friday, we conclude the week with
the US NFP report.
See the video below
This article was written by Giuseppe Dellamotta at www.forexlive.com.
Source link