Fundamental
Overview
Gold has been feeling the pressure from the rise in real yields in the last
part of May which led to a drop and a consolidation around the 2340 level. More
recently, the data showed that the inflation scare of the first part of the
year seems to be in the rear-view mirror and therefore real yields dropped
giving a boost to gold prices.
There’s no strong case for either a rally or a
selloff right now, but the bias turned a bit more bullish, nonetheless. A very hot NFP report tomorrow might trigger another drop, but if there are
no clear indications of inflationary pressures via wages, the market might
eventually erase the losses. Conversely, a weak report should give the market
another boost and take us to a new all-time high faster.
Gold
Technical Analysis – Daily Timeframe
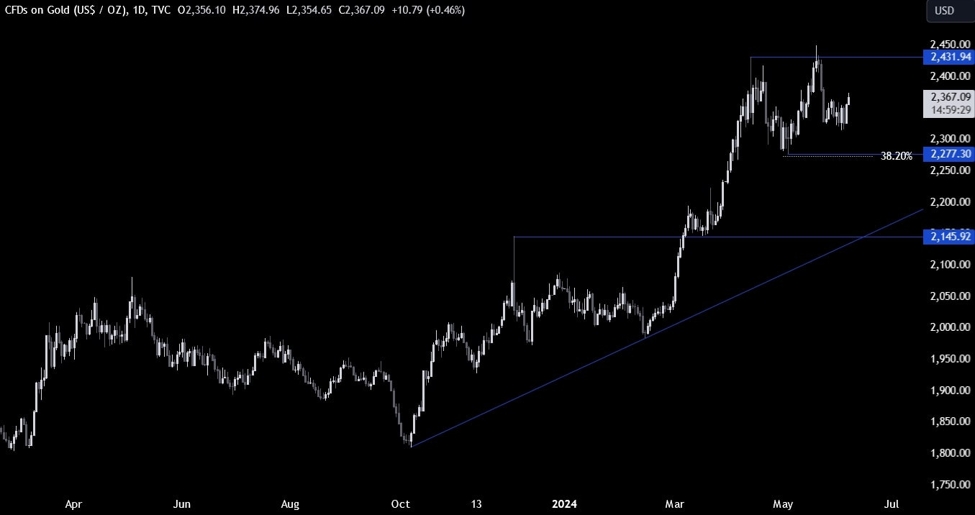
On the daily chart, we can
see that gold has been consolidating around the 2340 level and got a boost
recently as the data gave more confidence to the market that the inflation scare
could be behind us.
From a risk management
perspective, the buyers will have a better risk to reward setup around the 2277
support where we can also find the 38.2% Fibonacci retracement level for confluence. The sellers, on the other hand,
will want to see the price breaking lower to increase the bearish bets into the
major trendline around the 2150 level.
Gold Technical Analysis
– 4 hour Timeframe
On the 4 hour chart, we can
see more clearly the consolidation around the 2340 level. The price yesterday
broke above the swing high at 2364, which should have switched the technical
bias more to the bullish side.
This is where we can expect
the buyers to step in with a defined risk below the level to increase the
bullish bets into a new all-time high. The sellers, on the other hand, will want
to see the price falling back below the level to pile in and target a drop back
into the recent lows.
Gold Technical Analysis
– 1 hour Timeframe
On the 1 hour chart, we can
see that in case the price falls below the 2364 level, the buyers will find support
around the 2350 level where we can find the confluence of the swing level, the minor
trendline and the 50% Fibonacci retracement level.
The sellers, on the other
hand, will want to see the price breaking lower to increase the bearish bets
into the lows and target a breakdown to new lows. The
red lines define the average daily range for today.
Upcoming
Catalysts
Today we get the latest US Jobless Claims figures, while tomorrow we conclude
the week with the US NFP report.
See the video below
This article was written by Giuseppe Dellamotta at www.forexlive.com.
Source link


