
Fundamental
Overview
Gold has been on a steady
rise recently due to a geopolitical driver coming from the Middle East and a
fall in real yields.
Yesterday, we saw a drop
after a benign US
CPI report which might have been due just to technicals as we were at a key
resistance level or a repricing in interest rates expectations.
In fact, the probabilities
for a 50 bps cut in September continue to recede and if we keep on getting
pretty stable economic data, then the market will likely need to pare back the
aggressive rate cuts expectations putting a lid on gold’s gains.
In the big picture, gold
should remain supported as we head into the Fed’s easing cycle, but in the
short-term the repricing in interest rates due to better data than feared could
weigh on the market.
Gold
Technical Analysis – Daily Timeframe
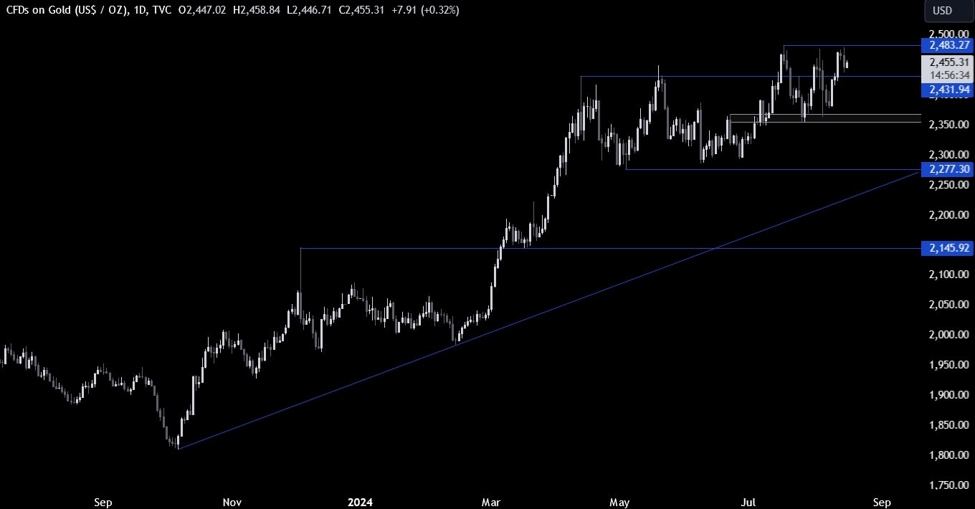
On the daily chart, we can
see that gold got rejected from the resistance zone around the 2483 level as the
sellers stepped in with a defined risk above the resistance to position for a
drop all the way back to the 2360 support. The buyers will want to see the
price breaking above the resistance to gain more conviction and pile in for a
rally into new highs.
Gold Technical Analysis
– 4 hour Timeframe
On the 4 hour chart, we can
see that the price remains confined in a range between the 2360 support and the
2483 resistance. In the big picture, the market participants will likely keep
on “playing the range” by buying at support and selling at resistance until we
get a breakout. In the more short-term a break below the 2430 level should see
the bearish momentum increasing with the sellers piling in more aggressively.
Gold Technical Analysis
– 1 hour Timeframe
On the 1 hour chart, we can
see that the price yesterday broke out of the recent tight range to the
downside and rallied back to retest the support
now turned resistance. This is where we can expect the sellers to step in
with a defined risk above the level to position for a drop into the 2430 level
targeting a break below it.
The buyers, on the other
hand, will want to see the price rising back above the resistance to regain
some control and position for a rally back into the 2483 resistance targeting a
breakout. The red lines define the average daily range for today.
Upcoming
Catalysts
Today we get the US Retail Sales and Jobless Claims figures. Tomorrow, we
conclude the week with the University of Michigan Consumer Sentiment survey.
See the video below
This article was written by Giuseppe Dellamotta at www.forexlive.com.
Source link