
Fundamental
Overview
The bullish momentum in
gold weakened recently as the pressure from the rising real yields started to
weigh on the market. We haven’t got any meaningful catalyst in the last week
but there’s been a good argument that the markets have been already positioning
into a Trump victory.
In the bigger picture, gold
remains in a bullish trend as real yields will likely continue to fall amid the
Fed’s easing cycle. The pullbacks will likely be triggered by a repricing in
rate cuts expectations but unless the Fed’s reaction function changes, the
uptrend should remain intact.
In fact, the US election
will be a huge catalyst for gold as a Trump victory, and more specifically a
Republican sweep, will likely raise real yields on higher growth and less rate
cuts expectations and trigger a strong selloff.
Gold
Technical Analysis – Daily Timeframe
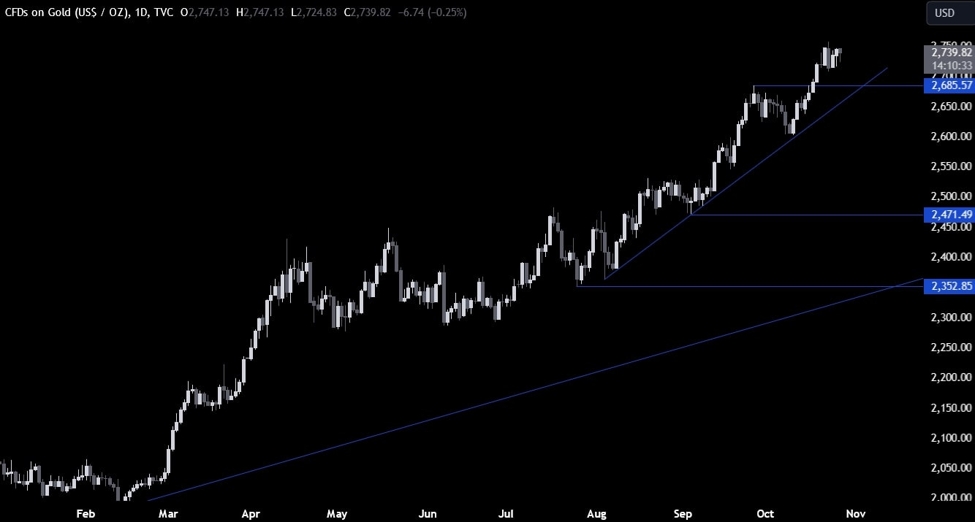
On the daily chart, we can
see that gold managed to rally into a new all-time high last week but couldn’t
extend into a new one as the pressure from rising real yields started to build.
From a risk management perspective, the buyers will have a better risk to
reward setup around the major trendline. The sellers, on the other hand, will
want to see the price breaking below the trendline to pile in for a drop into
the 2500 level.
Gold Technical Analysis
– 4 hour Timeframe
On the 4 hour chart, we can
see that the price recently broke below the minor trendline that was defining the bullish
momentum on this timeframe. This is generally a signal of weakening momentum. The
price consolidated since then with a rangebound price action near the all-time
high.
Gold Technical Analysis
– 1 hour Timeframe
On the 1 hour chart, we can
see that we have a minor resistance zone around the 2740 level with the
price trading in a rising channel. The buyers will want to see the price
breaking above the top trendline to position for a rally into a new all-time
high, while the sellers will likely keep on stepping in around these levels to
target a pullback into the 2685 level. The red lines define the average daily range for today.
Upcoming
Catalysts
Tomorrow we have the US Job Openings and the US Consumer Confidence report. On
Wednesday, we get the US ADP and the US GDP. On Thursday, we have the US PCE,
the US Jobless Claims and the US Employment Cost Index data. Finally, on
Friday, we conclude the week with the US NFP and the US ISM Manufacturing PMI.
This article was written by Giuseppe Dellamotta at www.forexlive.com.
Source link