
Fundamental
Overview
Gold continues to rise amid
lots of bullish drivers. We recently had a dovish Fed decision where Fed Chair Powell hinted to a
September rate cut and didn’t even close the door for “several” rate cuts
before the end of the year. Last Friday, we got an ugly US NFP report as the unemployment jumped to a
totally unexpected 4.3% rate.
Since then, we saw risk off
flows across the board with bonds rallying and the stock market falling. The
market is now pricing in 125 bps of easing by year-end which translates into a
50 bps cut in both September and November and a 25 bps cut in December.
Real yields are falling, which
is a good thing for gold, but in extreme cases when inflation expectations fall
faster than nominal yields, real yields can rise and hurt gold. This is
something that happened in the last two recessions. A stock market crash could
trigger such an event.
Gold
Technical Analysis – Daily Timeframe
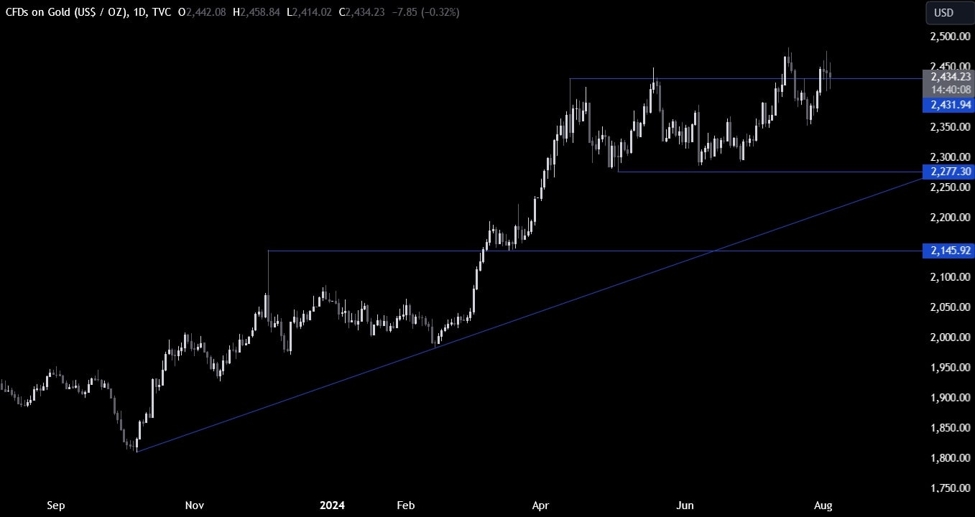
On the daily chart, we can
see that gold is consolidating around the key 2430 resistance. The buyers are piling in to
position for a new all-time high, while the sellers are looking for a break
lower to position for a drop back into the 2277 support.
Gold Technical Analysis
– 4 hour Timeframe
On the 4 hour chart, we can
see that the price tested several times the upward trendline as the buyers continue to lean on
it to position for new highs. The sellers will want to see the price breaking
below the trendline to gain more control and extend the drop into new lows.
Gold Technical Analysis
– 1 hour Timeframe
On the 1 hour chart, we can
see more clearly the consolidation around the 2340 resistance. There’s not much
we can glean from this timeframe as the buyers will just want the price to stay
above the trendline to keep targeting new highs, while the sellers will look
for a break lower to increase the bearish momentum. The red lines define the average daily range for today.
Upcoming
Catalysts
This week is basically empty on the data front. Today we have the US ISM Services
PMI and on Thursday we get the latest US Jobless Claims figures. The market
will also pay close attention to Fed members’ comments given the latest
developments.
See the video below
This article was written by Giuseppe Dellamotta at www.forexlive.com.
Source link