
Fundamental
Overview
Gold has been on a steady
rise since the latter part of last week alongside crude oil which suggests that
the price action might have been driven more by the tensions in the Middle East.
That became even more evident yesterday as we got a Fox
report saying that Iran could have attacked Israel in less than 24 hours
which triggered another wave of buying.
Tonight we got another
report saying that the attack wasn’t going to happen today which led to a
pullback. On the macro side, after some tightening in real yields following the
last Monday’s stock market rout, the volatility in the market normalised and
real yields fell giving gold some more support.
There might also be some
positioning into a benign US CPI report tomorrow as the latest US PMIs showed more
easing in inflationary pressures with the commentary noting that “the rate of increase
of average prices charged for goods and services has slowed further, dropping
to a level consistent with the Fed’s 2% target”.
Gold
Technical Analysis – Daily Timeframe
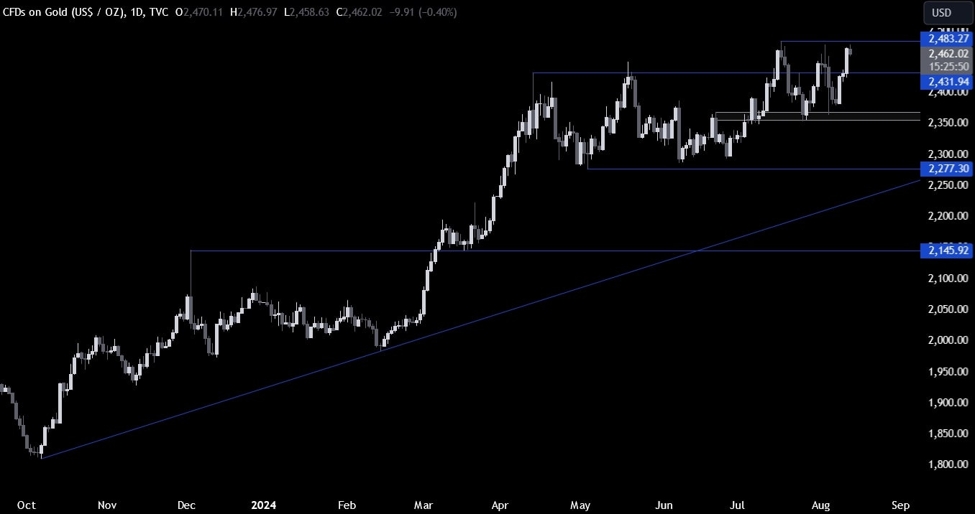
On the daily chart, we can
see that gold eventually rallied all the way back to the resistance
zone around the 2483 level. This is where we can expect the sellers to step in
with a defined risk above the level to position for a drop back into the 2360
support. The buyers, on the other hand, will want to see the price breaking
higher to increase the bullish bets into new all-time highs.
Gold Technical Analysis
– 4 hour Timeframe
On the 4 hour chart, we can
see that the price remains confined in a range between the 2360 support and the
2483 resistance. The market participants might keep on “playing the range” by
buying at support and selling at resistance until we get a breakout.
Gold Technical Analysis
– 1 hour Timeframe
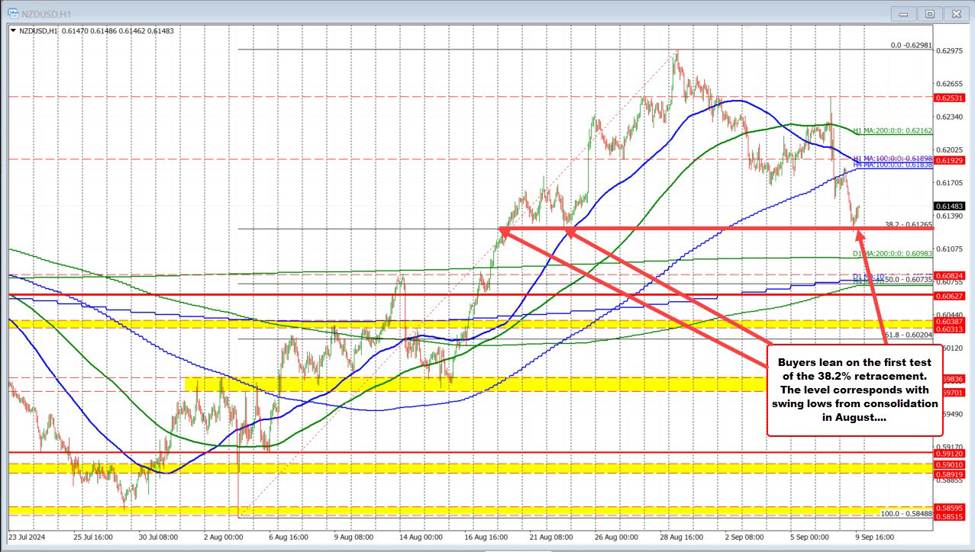
On the 1 hour chart, we can
see that we have an upward trendline
defining the current bullish momentum. The buyers will likely lean on the
trendline to position for a break above the resistance with a better risk to
reward setup. The sellers, on the other hand, will want to see the price breaking
lower to increase the bearish bets into the 2360 support. The red lines define
the average daily range for today.
Upcoming
Catalysts
Today we get the US PPI data. Tomorrow, we have the US CPI report. On
Thursday, we get the US Retail Sales and Jobless Claims figures. Finally, on
Friday, we conclude the week with the University of Michigan Consumer Sentiment
survey.
See the video below
This article was written by Giuseppe Dellamotta at www.forexlive.com.
Source link