
Fundamental
Overview
In recent days, gold has
been making new highs despite the lack of bullish catalysts. Moreover, the
latest leg higher diverged with real yields which climbed to new highs since
last week.
This divergence could point
to a pullback in gold ahead of the Flash US PMIs on Thursday, and if we get
strong data, it might even trigger a quick correction lower.
In the bigger picture, gold
remains in a bullish trend as real yields will likely continue to fall amid the
Fed’s easing cycle. The pullbacks will likely be triggered by a repricing in
rate cuts but unless the Fed’s reaction function changes, the uptrend should
remain intact.
One key event which could
trigger a strong selloff in gold is the upcoming US election. In fact, a Trump
victory will likely raise real yields on higher growth and less rate cuts
expectations.
Gold
Technical Analysis – Daily Timeframe
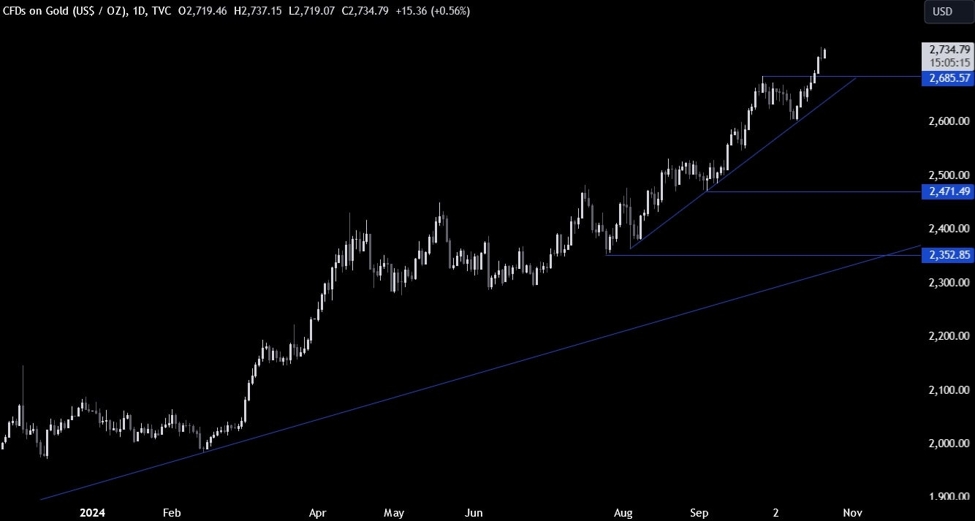
On the daily chart, we can
see that gold managed to rally into new highs despite the lack of bullish
catalysts and the rise in real yields. This might be a signal for the buyers to
be cautious here. From a risk management perspective, the buyers will have a
better risk to reward setup around the major trendline. The sellers, on the other hand,
will want to see the price breaking below the trendline to pile in for a drop into
the 2500 level.
Gold Technical Analysis
– 4 hour Timeframe
On the 4 hour chart, we can
see that we have another minor upward trendline defining the current bullish
momentum. The buyers will likely keep on leaning on it to target new highs,
while the sellers will look for a break lower to target a drop into the previous
all-time high at 2685.
Gold Technical Analysis
– 1 hour Timeframe
On the 1 hour chart, we can
see that yesterday we got a quick drop lower although it wasn’t triggered by
any catalyst other than some pressure coming from the rise in Treasury yields.
The market eventually erased the drop, and the price is now back around the
all-time highs.
Although we might see new
highs, the risk of chasing the upside at the moment is too high. The red lines
define the average daily range for today.
Upcoming
Catalysts
This week is pretty empty on the data front with market moving releases scheduled
for the latter part of the week. On Thursday, we get the Flash US PMIs and the
US Jobless Claims figures.
See the video below
This article was written by Giuseppe Dellamotta at www.forexlive.com.
Source link