
Fundamental
Overview
Gold got a boost recently on
renewed tensions in the Middle East. In fact, on Tuesday, Israel struck Beirut
(Lebanon) targeting the Hezbollah commander that launched a recent missile
attack against Israel. Just some hours later, Israel managed to
kill the top Hamas leader in Teheran (Iran).
Moreover, we had the FOMC
rate decision yesterday
and as expected it was a dovish one. Fed Chair Powell hinted to a September rate
cut and didn’t even close the door for “several” rate cuts before the end of
the year. Eventually, gold got another boost late in the day as we got the news
that Iran ordered
a strike against Israel.
Gold
Technical Analysis – Daily Timeframe
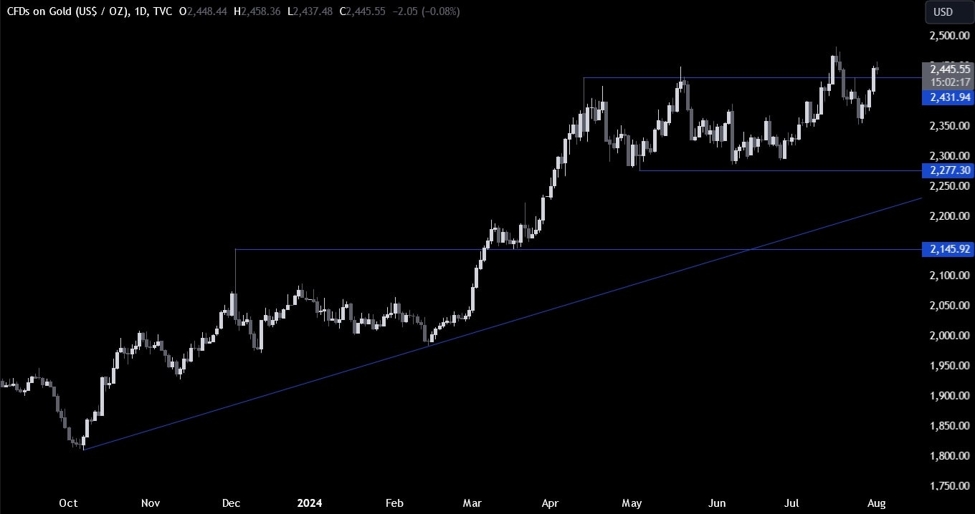
On the daily chart, we can
see that gold managed to break above the 2430 resistance again following some renewed
tensions in the Middle East. The buyers will likely have some more conviction
now and will likely increase their bullish bets into new all-time highs. The
sellers, on the other hand, will want to see the price falling back below the
2430 level to pile in for a drop into the 2277 support.
Gold Technical Analysis
– 4 hour Timeframe
On the 4 hour chart, we can
see that the price broke above the downward trendline and extended the rally into new
highs as the buyers piled in more aggressively. We should see more buying
pressure coming into the market at these levels but if we were to see the price
falling back below the 2430 level, then we can expect the drop to extend into
the minor upward trendline where the buyers will have another dip-buying
opportunity. The sellers, on the other hand, will look to pile in at the break
below the 2430 level and the break below the upward trendline targeting the
2277 support.
Gold Technical Analysis
– 1 hour Timeframe
On the 1 hour chart, we can
see that we have another minor trendline defining the current bullish momentum.
The buyers will likely lean on the trendline with a defined risk below the 2430
level to position for a rally into a new all-time high. The sellers, on the
other hand, will want to see the price breaking below those key levels to position
for a drop into the next trendline. The red lines define the average daily range for today.
Upcoming
Catalysts
Today we get the latest US Jobless Claims figures and the US ISM
Manufacturing PMI. Tomorrow, we conclude the week with the US NFP report.
See the video below
This article was written by Giuseppe Dellamotta at www.forexlive.com.
Source link