
Fundamental
Overview
After the breakout of the
2480 resistance, gold eventually extended the gains into the 2532 level as the momentum
buyers piled in.
In the big picture, gold
should remain supported as real yields fall as we head into the Fed’s easing
cycle, but in the short-term strong US data might provide pullbacks along the
way.
Tomorrow, we get the Flash
US PMIs and in case the data surprises to the upside, it could lead to some
weakness in gold, and it will be interesting to see if the market decides to
fade it or it will trigger a bigger correction to the downside.
Gold
Technical Analysis – Daily Timeframe
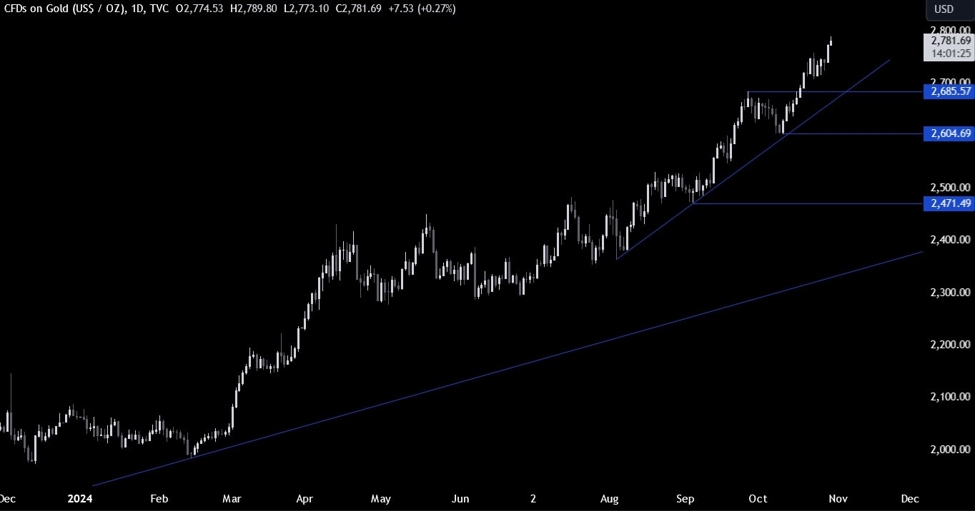
On the daily chart, we can
see that gold recently managed to break above the key resistance zone around the 2480 level and
extended the gains into the 2532 level as more buyers piled in.
The buyers are now in
control and the breakout should give them more conviction to target new highs.
The sellers, on the other hand, will want to see the price falling back below
the 2480 level to invalidate the breakout and position for a drop into the 2360
level.
Gold Technical Analysis
– 4 hour Timeframe
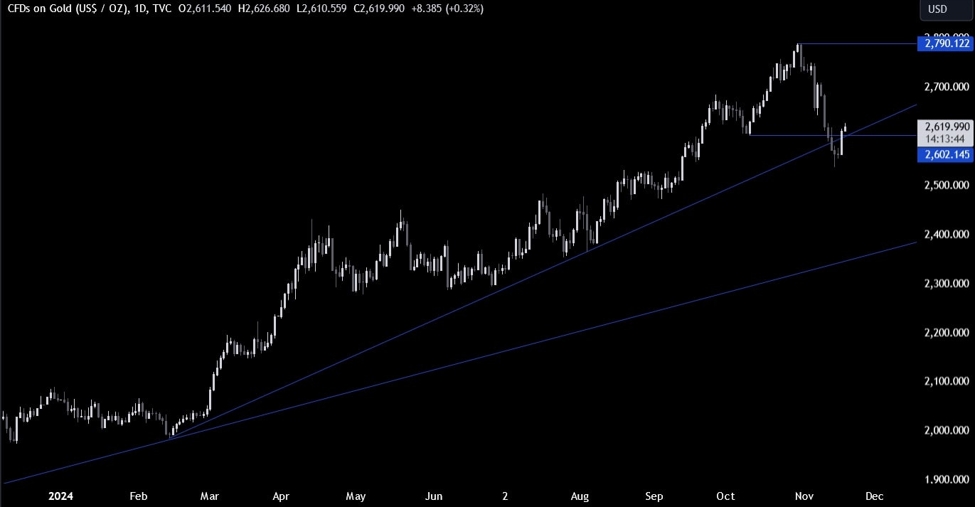
On the 4 hour chart, we can
see that we have now have a strong support zone around the 2480 level where we
can find the confluence
of the trendline
and the 50% Fibonacci
retracement level.
If were to get a pullback
into the support, we can expect the buyers to step in with a defined risk below
the trendline to position for new highs with a better risk to reward setup. The
sellers, on the other hand, will want to see the price breaking below the
trendline to invalidate the breakout and position for a drop into the 2360
level.
Gold Technical Analysis
– 1 hour Timeframe
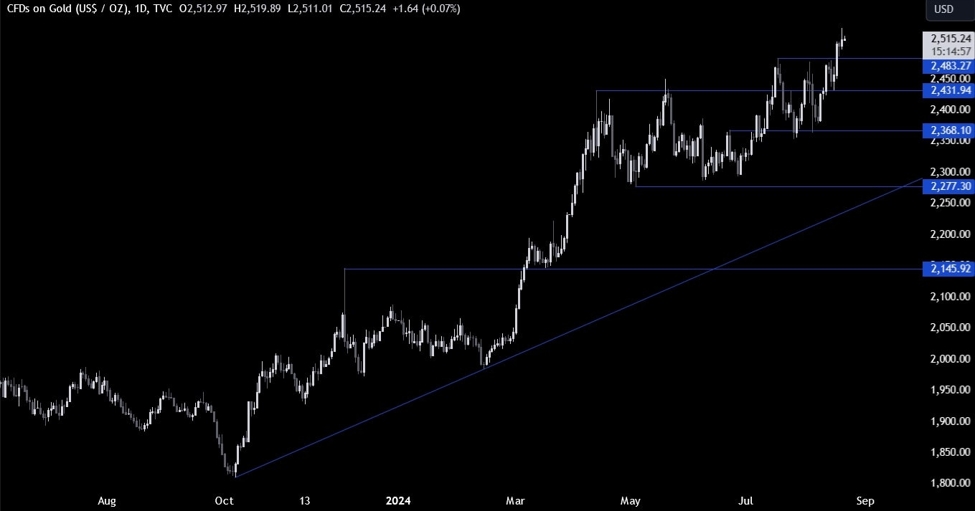
On the 1 hour chart, we can
see that the price recently bounced on the minor upward trendline to reach new
highs but it’s now trading below it. This might be a signal that the bullish
momentum has waned a bit and a pullback into the 2480 support is more likely. The
red lines define the average daily range for today.
Upcoming
Catalysts
Tomorrow we get the US Jobless Claims figures and the US PMIs. On Friday we
conclude with Fed Chair Powell speaking at the Jackson Hole Symposium.
See the video below
This article was written by Giuseppe Dellamotta at www.forexlive.com.
Source link