Fundamental
Overview
Yesterday, we got the US
CPI report and, although as expected it didn’t have the same impact as it
used to, the core m/m figure surprised to the upside. The shelter component re-accelerated
and that’s something to keep an eye on given the imminent rate cut cycle as we
might get a reacceleration in the economic activity.
The data didn’t give the
gold bulls a strong reason to break out of the range and therefore, we will
likely keep on bouncing around until the FOMC decision next week unless the US
Jobless Claims today spike above the 260K level.
Gold
Technical Analysis – Daily Timeframe
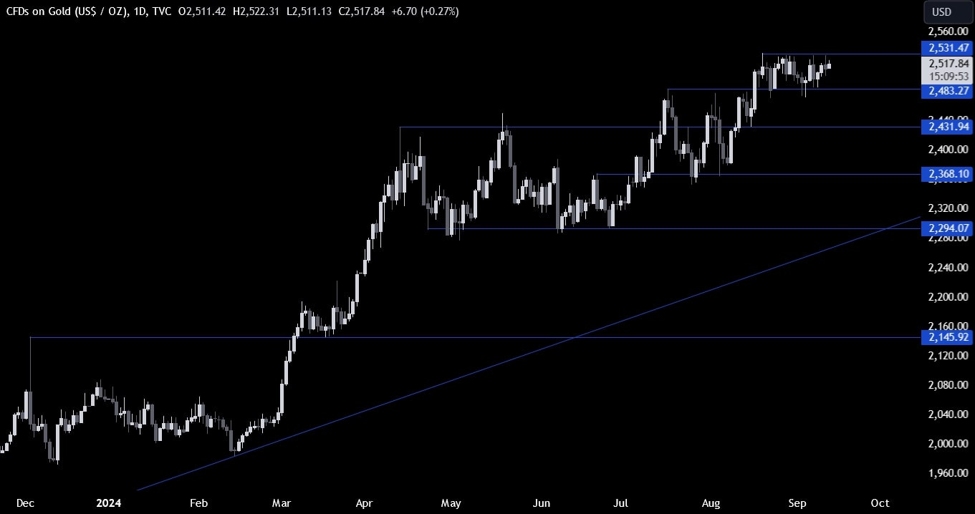
On the daily chart, we can
see that gold remains stuck in the range between the 2480 support and the 2530 resistance. We will need a strong
catalyst to break out of the range and if it doesn’t come this week, it will
definitely come next week with the FOMC decision.
Gold Technical Analysis
– 4 hour Timeframe
On the 4 hour chart, we can
see more clearly the range between the 2480 support and the 2530 resistance. The
market participants keep on “playing the range” by buying at support and
selling at resistance waiting for a breakout on either side.
Gold Technical Analysis
– 1 hour Timeframe
On the 1 hour chart, we can
see that we have an interesting zone around the 2505 level where the price
reacted to several times in the past couple of weeks. This might act as kind of
barometer for the sentiment with the price staying above being more bullish and
staying below being more bearish. The red lines define the average daily range for today.
Upcoming
Catalysts
Today we get the latest US Jobless Claims figures and the US PPI data. Tomorrow,
we conclude the week with the University of Michigan Consumer Sentiment report.
This article was written by Giuseppe Dellamotta at www.forexlive.com.
Source link


