Fundamental
Overview
Gold made a new weekly high
yesterday as the price broke above a key level. We have the US NFP and CPI
reports ahead and they are going to move the market a lot so the recent
breakout could turn into a fakeout pretty easily.
The market’s pricing didn’t
change much as roughly two rate cuts for this year remain the base case. The
Fed is placing a great deal on inflation progress to proceed with further cuts,
so the US CPI report next week is going to have a bigger influence on interest
rate expectations.
Nonetheless, a soft NFP
report should trigger a dovish market reaction and give gold a boost considering
that we’ve seen a pretty strong selloff in the bond market on the repricing of
rate cuts. Conversely, a hot report across the board will likely send gold
lower with the 2600 support potentially coming under threat.
Gold
Technical Analysis – Daily Timeframe
On the daily chart, we can
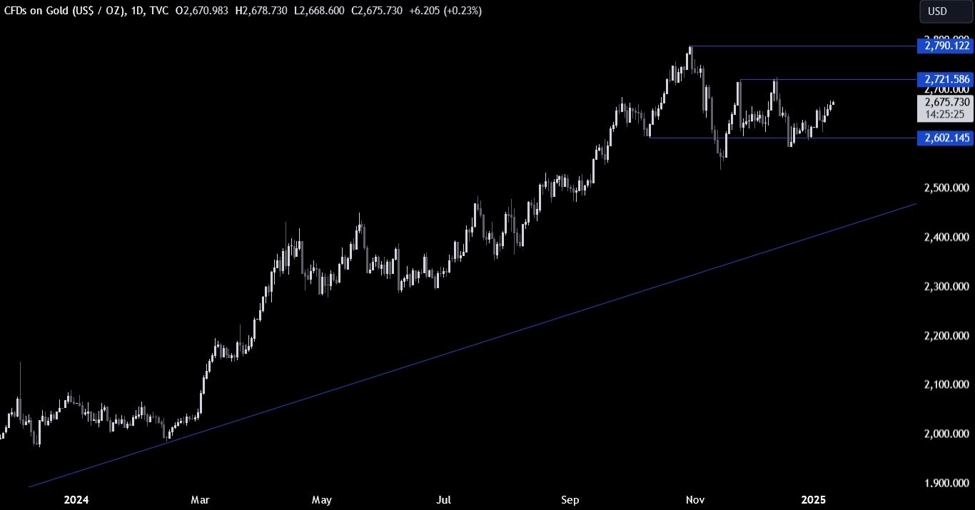
see that gold continues to trade inside the range between the 2600 support and the 2721 resistance. The price is now
trading above the middle of the range as the buyers keep on pushing towards the
resistance. The sellers, on the other hand, will likely pile in around the
resistance or look for a break below the support to target a drop into the
major trendline around the 2500 level.
Gold Technical Analysis
– 4 hour Timeframe
On the 4 hour chart, we can
see more clearly the recent break above the middle of the range around the 2660
level with the buyers piling in to position for a rally into the resistance
next. The sellers will want to see the price falling back below the 2660 level
to position for a drop back into the 2600 support.
Gold Technical Analysis
– 1 hour Timeframe
On the 1 hour chart, there’s
not much else we can add here as the buyers will keep on stepping in above the
2660 zone, while the sellers will look for a drop below it to target a move
back into the support. The red lines define the average daily range for today.
Upcoming
Catalysts
Today, we conclude the week with the US NFP report.
Watch the video below
This article was written by Giuseppe Dellamotta at www.forexlive.com.
Source link


