
Fundamental
Overview
Yesterday, we got some positive
US data releases as the US
retail sales came out a touch better than expected and the industrial
production data beat forecasts erasing the hurricane related weakness in
July.
The data put some pressure
on gold and we might see some profit-taking given that it’s unlikely that the
Fed will be able to out-dove the markets expectations today.
The market is pricing a 63%
probability that the Fed cuts rates by 50 bps today and then delivers 250 bps
of easing by the end of 2025. That seems a bit too aggressive at the moment, so
the market might get disappointed for the 2025 pricing.
Gold
Technical Analysis – Daily Timeframe
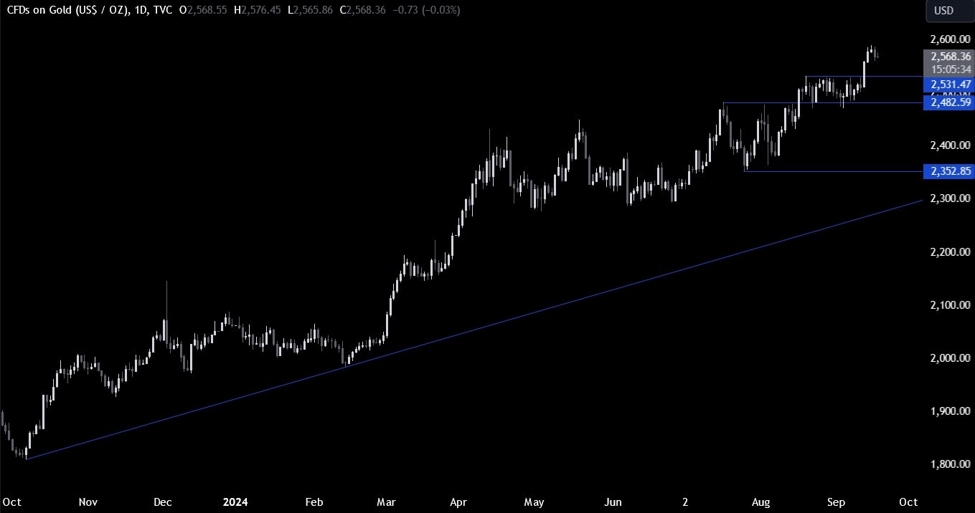
On the daily chart, we can
see that gold is slowly edging lower as some profit-taking after the recent
rally might be taking place. From a risk management perspective, the buyers
will have a better risk to reward setup around the previous resistance now turned support to position for the continuation of
the uptrend. The sellers, on the other hand, don’t have any level where to lean
on this timeframe, so we need to zoom in to see some more details.
Gold Technical Analysis
– 4 hour Timeframe
On the 4 hour chart, we can
see more clearly the setup around the 2532 support
where we can also find the confluence
of the 50% Fibonacci
retracement level and the trendline.
This is where the buyers will likely step in with a defined risk below the
trendline to position for a new all-time high. The sellers, on the other hand,
will want to see the price breaking lower to pile in for a drop into the 2482
level.
Gold Technical Analysis
– 1 hour Timeframe
On the 1 hour chart, we can
see that we have a minor resistance around the 2575 level where have also a downward
trendline for confluence. If we get a pullback into the resistance, we can
expect the sellers to step in to position for a drop into the 2532 support. The
buyers, on the other hand, will want to see the price breaking higher to
increase the bullish bets into new highs. The red lines define the average daily range for today.
Upcoming
Catalysts
Today, we have the FOMC Rate Decision and tomorrow, we get the latest US
Jobless Claims figures.
See the video below
This article was written by Giuseppe Dellamotta at www.forexlive.com.
Source link