
Fundamental
Overview
The weak US NFP report last Friday triggered risk-off flows.
Things got dire on Monday as the Japanese Nikkei dropped 12% overnight and we
saw a general selloff in global stock markets.
At one point, the markets
saw the Fed cutting rates by 136 bps by year-end and some chances of an
emergency rate cut. Although the volatility calmed down a bit and markets
recovered the Monday’s losses, the expectations haven’t changed much as the
market is still pricing a higher probability for a 50 bps cut by the Fed in
September and a total of 103 bps by year-end.
The GBP gained against the
USD on Friday due to the aggressive rate cuts pricing for the Fed but
eventually gave way to the greenback as the risk-off intensified on Monday
morning. We had another selloff on Tuesday morning although there wasn’t any
clear catalyst. The sentiment is still fragile, and flows are dominating the
price action.
GBPUSD
Technical Analysis – Daily Timeframe
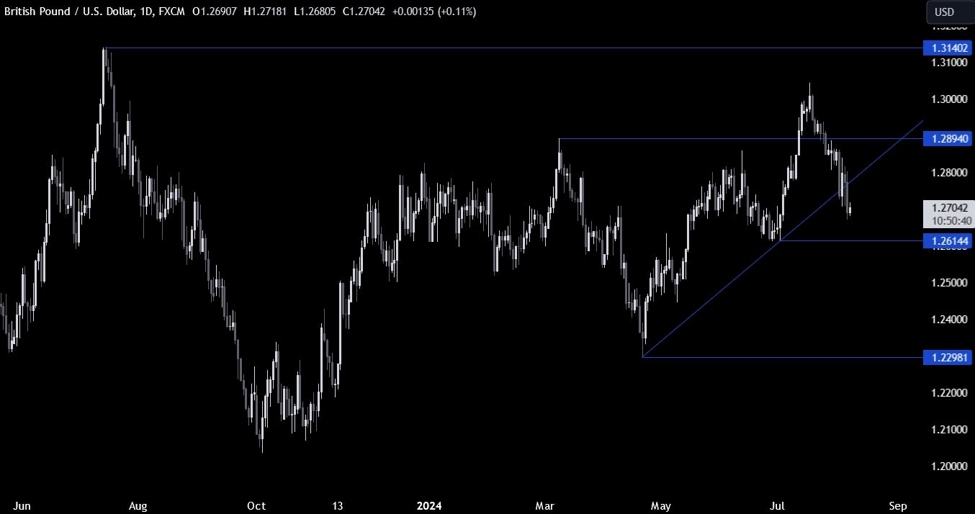
On the daily chart, we can
see that GBPUSD dropped below the major trendline and extended the selloff into the
1.2677 level as the bearish momentum increased. The natural target for the
sellers should be the swing low level at 1.2615.
If the price gets there, we
can expect the buyers to step in with a defined risk below the level to
position for a rally into new highs. The sellers, on the other hand, will want
to see the price breaking lower to increase the bearish bets into the 1.25
handle next.
GBPUSD Technical
Analysis – 4 hour Timeframe
On the 4 hour chart, we can
see that we have a downward trendline defining the current bearish momentum.
The sellers will likely keep on leaning on it to position for further downside,
while the buyers will want to see the price breaking above the trendline to
regain some control and pile in for new highs.
GBPUSD Technical
Analysis – 1 hour Timeframe
On the 1 hour chart, we can
see that we have a decent resistance
around the 1.2720 level where the price got rejected from several times. The
buyers will want to see the price breaking higher to position for a rally into
the downward trendline. The sellers, on the other hand, will likely lean on it
to position for a drop into the 1.2615 level. The red lines define the average daily range for today.
Upcoming
Catalysts
This week is basically empty on the data front. The only notable economic
releases will be on Thursday when we get the latest US Jobless Claims figures.
The market will also pay close attention to Fed members’ comments given the
latest developments in the markets.
This article was written by Giuseppe Dellamotta at www.forexlive.com.
Source link