
Fundamental
Overview
The USD has been on a hell
of a run recently despite the lack of catalysts and no major repricing in interest
rates expectations.
The main culprit for the
recent strength in the US Dollar has been the rally in long term Treasury
yields. The yield curve has been bear-flattening which is what you would expect with
higher growth and potentially higher inflation expectations.
There’s been a good
argument that the markets have been already positioning for a Trump victory
which is expected to strengthen the higher growth and less rate cuts
expectations.
For now, this is the trend
and it’s generally a bad idea to fight such trends without a catalyst.
Unfortunately, we don’t have much left for October as the main events will be
in the first weeks of November when we will get the top tier economic reports,
the US elections and the FOMC decision.
On the GBP side, we got the
UK
Flash PMIs this morning and the data missed expectations slightly across
the board. The market’s pricing didn’t change much though as the market
continues to expect a 25 bps cut at the upcoming meeting followed by another
one in December.
GBPUSD
Technical Analysis – Daily Timeframe
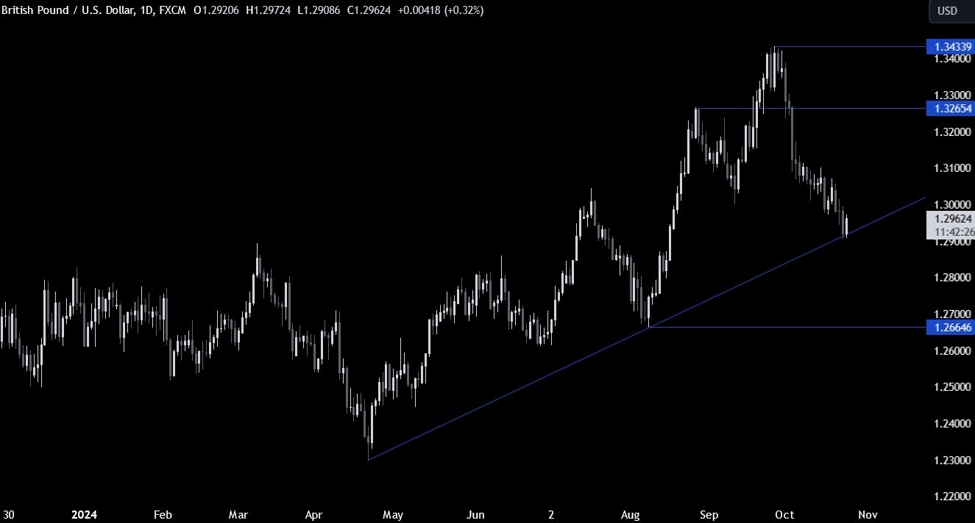
On the daily chart, we can
see that GBPUSD eventually reached the major trendline
and bounced off of it as the buyers stepped in. The first target for them
should be the 1.31 handle. The sellers, on the other hand, will want to see the
price breaking below the trendline to increase the bearish bets into the 1.27 handle.
GBPUSD Technical
Analysis – 4 hour Timeframe
On the 4 hour chart, we can
see that we have a minor downward trendline defining the current bearish
momentum. If the price gets there, we can expect the sellers to lean on it to
position for a break below the major trendline. The buyers, on the other hand, will
look for a break above the downward trendline to increase the bullish bets into
the 1.31 handle.
GBPUSD Technical
Analysis – 1 hour Timeframe
On the 1 hour chart, we can
see that we have another minor trendline defining the bearish momentum on this timeframe.
The buyers will want to see the price breaking higher to increase the bullish
bets into the next trendline, while the sellers will likely lean on it to
position for a break below the major trendline. The red line define the average daily range for today.
Upcoming
Catalysts
Today we have the US Jobless Claims and the US Flash PMIs.
This article was written by Giuseppe Dellamotta at www.forexlive.com.
Source link