Fundamental
Overview
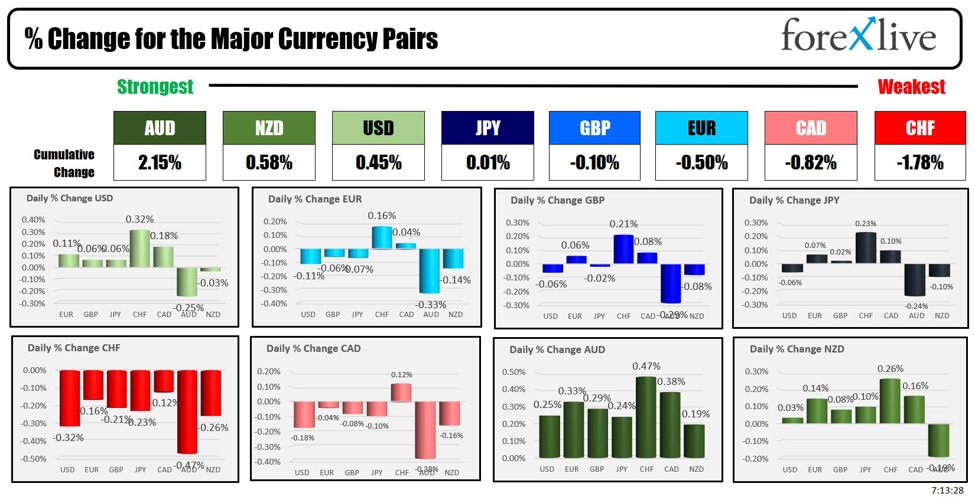
The USD weakened across the
board last week following another soft US CPI report and benign Jobless Claims figures. The market not only fully
priced in a rate cut in September but also started to price in some chances of
a back-to-back rate cut in November.
Overall, we had a
goldilocks data release with an economy that is slowing but still growing. This
should support the soft-landing narrative and be positive for the risk
sentiment.
The GBP, on the other hand,
keeps on gaining against the US Dollar mainly because of the risk-on sentiment
as the US data continues to support at least two rate cuts from the Fed without
sending recessionary signals.
On the monetary policy
front, the BoE in June left the door open for a rate cut in
August but BoE’s Pill poured some cold water on those
expectations. In fact, the market was assigning a 60% chance of a rate cut in
August but that went down to 50% following his comments.
We will likely need a very
good UK CPI report or very ugly UK Jobs data to see the BoE cutting rates at
the upcoming meeting.
GBPUSD
Technical Analysis – Daily Timeframe
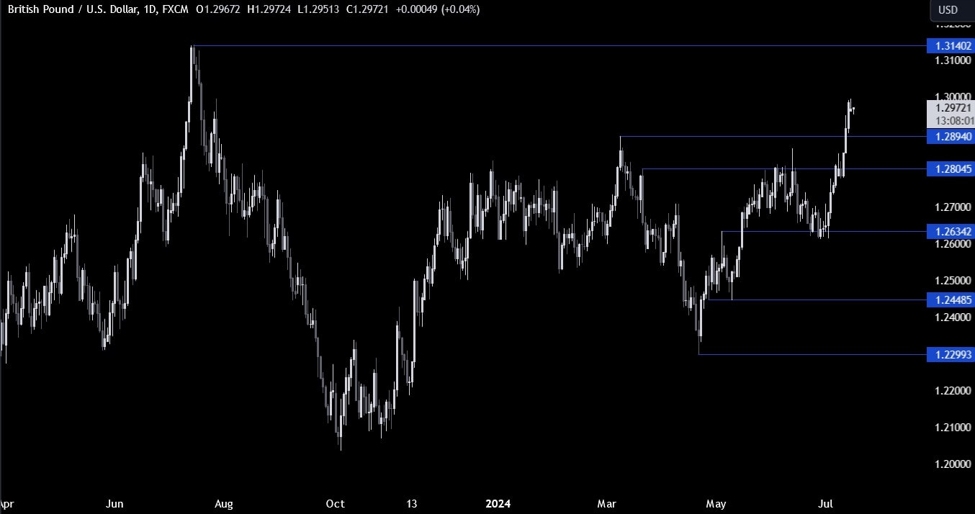
On the daily chart, we can
see that GBPUSD broke through the 1.28 handle last week on some hawkish
comments from BoE’s Pill and eventually extended the rally above the 1.29
handle following the soft US CPI report. The pair lost some momentum at the
1.30 handle as traders await the release of key UK data in the next days, but
all else being equal, the target should now be the cycle high at 1.3140.
GBPUSD Technical
Analysis – 4 hour Timeframe
On the 4 hour chart, we can
see that we now have a trendline defining the current bullish
momentum. From a risk management perspective, the buyers will have a better
risk to reward setup around the trendline and the 38.2% Fibonacci
retracement level to position for a continuation of the rally into the
1.3140 level next.
The sellers, on the other
hand, will want to see the price breaking below the trendline and the 1.29 level
to turn the bias more bearish and pile in for a drop back into the 1.28 handle.
GBPUSD Technical
Analysis – 1 hour Timeframe
On the 1 hour chart, we can
see that the price action became a bit rangebound near the 1.30 level and a
pullback would be a welcome thing for the buyers. We could see that happening
today as we get the US Retail Sales data. The red lines define the average daily range for today.
Upcoming
Catalysts
Today we get the US Retail Sales report. Tomorrow, we have the UK CPI and Fed’s
Waller speaking. On Thursday, we get the UK Labour Market report and the latest
US Jobless Claims figures. On Friday, we conclude the week with the UK Retail
Sales data.
This article was written by Giuseppe Dellamotta at www.forexlive.com.
Source link


