Fundamental
Overview
The USD has been generally
weaker this week after the strength seen last week due to some risk off
sentiment. In fact, it looks like it’s just sentiment that’s been driving the
market recently as fundamentally the soft US inflation figures just consolidated the market’s
expectation of two cuts for this year despite a bit more hawkish than expected FOMC decision.
The GBP, on the other hand,
got pressured mainly because of the risk-off sentiment and the US Dollar
strength. The mood in the market has been gradually improving this week and we
saw the Pound gaining ground as a consequence.
Today, we have the BoE
policy decision where the central bank is expected to keep the Bank Rate
unchanged at 5.25%. As a reminder, the last meeting was a bit more dovish than expected with Ramsden joining Dhingra voting for a rate cut and Governor Bailey delivering some dovish comments like saying that they could cut more
than the market expected.
It’s
pretty evident that the central bank is eager to cut but nonetheless wants a
bit more confidence before easing the policy rate. Yesterday’s UK CPI was
another step in the right direction (although services inflation remains very
high) but it wasn’t such a gamechanger in the bigger picture with the market
pricing remaining pretty much the same at 44 bps of easing by year end (48 bps
before the CPI release).
GBPUSD
Technical Analysis – Daily Timeframe
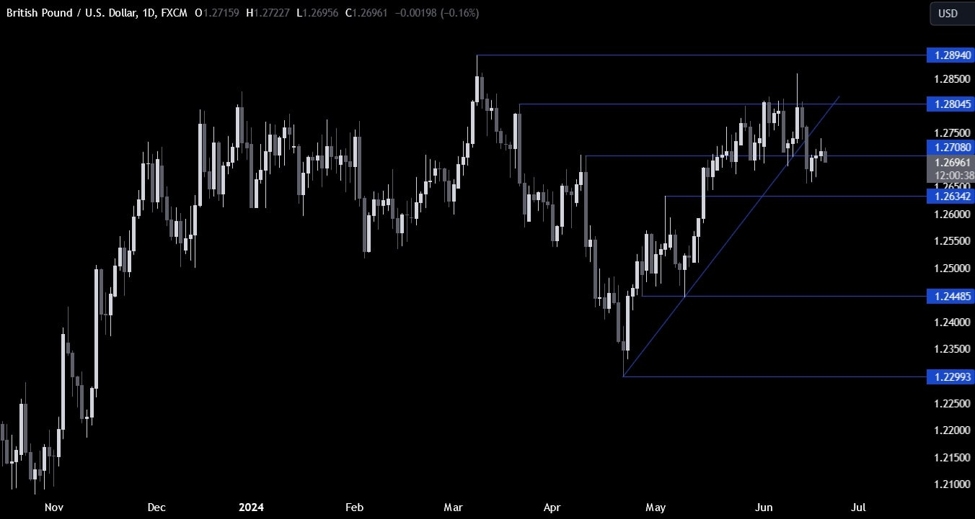
On the daily chart, we can
see that GBPUSD pulled back into the 1.27 handle this week and started to
consolidate around it amid a gradual but cautious improvement in risk
sentiment.
This is where we can expect
the sellers to step in to position for a break below the 1.2634 level and
target new lows. The buyers, on the other hand, will keep on buying the dips
looking for a rally into the 1.29 handle as long as the price remains above the
1.2634 level.
GBPUSD Technical
Analysis – 4 hour Timeframe
On the 4 hour chart, we can
see that we have also the 38.2% Fibonacci retracement level of the entire rally since
April standing around the 1.2634 level which should technically strengthen the support
level. As long as the price stays above the 1.27 handle the buyers should
remain in control as the price continues to print higher highs and higher lows.
GBPUSD Technical
Analysis – 1 hour Timeframe
On the 1 hour chart, we can
see more clearly the choppy price action around the 1.27 handle. From a risk
management perspective, the sellers will have a much better risk to reward
setup around the 1.28 handle, although it’s unlikely that we will see the price
reaching that level unless the BoE surprises with a hawkish decision.
The buyers, on the other
hand, will have a better risk to reward setup around the 1.2634 level which has
a higher chance of being reached in case the BoE surprises with a more dovish
than expected decision. The red lines define the average daily range for today.
Upcoming
Catalysts
Today we have the BoE Policy Decision followed by the US Housing Starts,
Building Permits and the US Jobless Claims figures. Tomorrow, we conclude the
week with the UK and the US PMIs.
This article was written by Giuseppe Dellamotta at www.forexlive.com.
Source link


