
Fundamental
Overview
Since last Friday, the USD
has been mostly weak as Fed Chair Powell delivered a more dovish than expected speech at the Jackson Hole Symposium where
he basically kept the door open for a 50 bps cut at the September meeting. In
fact, the line saying that they will do everything they can to support a strong
labour market was key.
That pushed Treasury yields
lower and weighed on the greenback across the board. In fact, the recent
appreciation of the EUR has been mostly driven by the US Dollar side of the
equation. The ECB started its easing cycle before the Fed and the market
expects the central bank to deliver at least two more rate cuts before
year-end.
EURUSD Technical
Analysis – Daily Timeframe
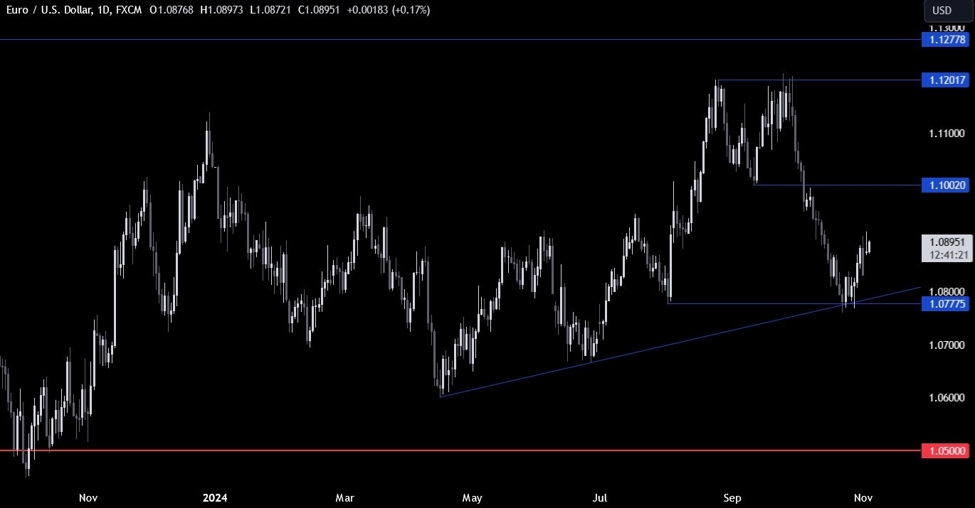
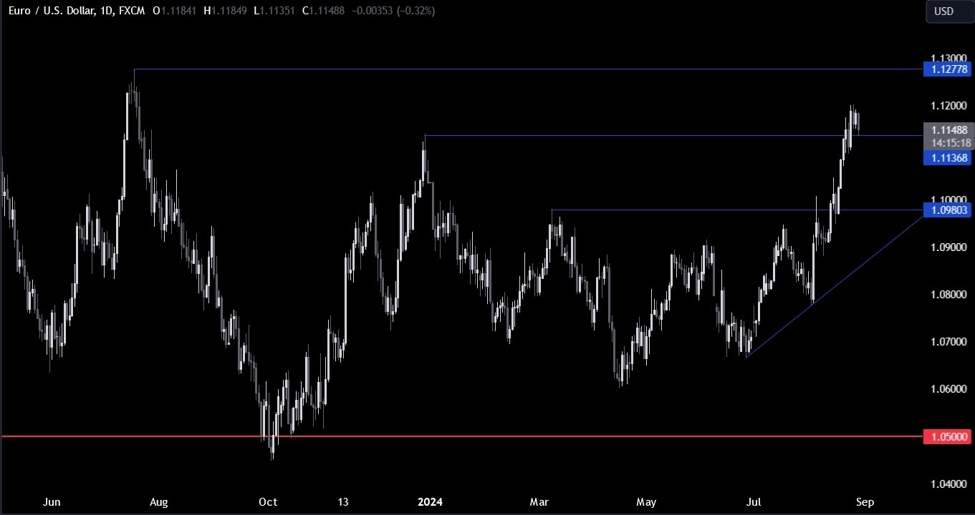
On the daily chart, we can
see that EURUSD eventually managed to break above the 1.1136 level and
consolidated just above it. We can expect the buyers to pile in around these
levels to position for a rally into a new cycle high at the 1.13 handle. The
sellers, on the other hand, will want to see the price falling back below the
1.11 handle to position for a drop back into the 1.10 handle.
EURUSD Technical
Analysis – 4 hour Timeframe
On the 4 hour chart, we can
see that we have a good support zone around the 1.11 handle where we can find
the confluence of the previous swing low level,
the trendline and the 38.2% Fibonacci retracement level.
If we get a pullback into that
support zone, we can expect the buyers to lean on the trendline to position for
a rally into the 1.13 handle. The sellers, on the other hand, will want to see
the price breaking lower to position for a drop into the 1.10 handle.
EURUSD Technical Analysis – 1 hour Timeframe
On the 1 hour chart, we can
see that after the spike higher triggered by the dovish Powell’s speech, the
price action has been tentative as the market awaits the release of key
economic data next week. If we start to see another wave of buying though and
the price breaks above the counter-trendline around the 1.1190, we can expect
the bullish momentum to increase as more buyers will likely pile in for the
rally into a new cycle high. The red lines define the average daily range for today.
Upcoming
Catalysts
Tomorrow we get the latest US Jobless Claims figures, while on Friday, we
conclude the week with the US PCE report.
See the video below
This article was written by Giuseppe Dellamotta at www.forexlive.com.
Source link